All official European Union website addresses are in the europa.eu domain.
See all EU institutions and bodiesAn official website of the European Union | How do you know?
Environmental information systems
EN
- БългарскиBG
- češtinaCS
- HrvatskiHR
- danskDA
- NederlandsNL
- ελληνικάEL
- EnglishEN
- eestiET
- SuomiFI
- FrançaisFR
- DeutschDE
- magyarHU
- ÍslenskaIS
- italianoIT
- LatviešuLV
- lietuviųLT
- MaltiMT
- NorskNO
- polskiPL
- PortuguêsPT
- RomânăRO
- slovenčinaSK
- SlovenščinaSL
- EspañolES
- SvenskaSV
- TürkçeTR
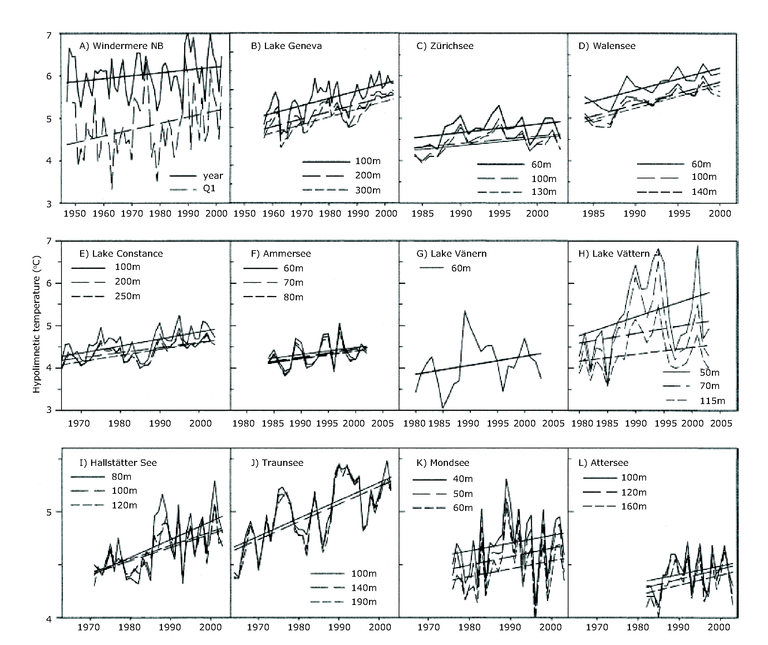
Time series and regression lines for annual average deepwater temperatures
Chart (static)
-
Downloads
Data sources
Metadata
More info
Loading
- Austria
- France
- Germany
- Sweden
- Switzerland
- United Kingdom
1970-2000
(A) Windermere North Basin 60 m and the first 10-week period (Q1), (B) Lake Geneva, (C) Zürichsee, (D) Walensee, (E)
Lake Constance, (F) Ammersee, (G) Lake Vänern, (H) Lake Vättern, (I) Hallstättersee, (J) Traunsee, (K) Mondsee, and (L)
Attersee for the depths indicated . T-increase in all lakes was 0.1–0.2 °C/decade.