Personal tools

Sign up now!
Get notifications on new reports and products. Currently we have 60173 subscribers. Frequency: 3-4 emails / month.
Follow us
Twitter icon Twitter
Facebook icon Facebook
YouTube icon YouTube channel
RSS logo RSS Feeds
Notifications archive

Write to us Write to us

For the public:


For media and journalists:

Contact EEA staff
Contact the web team
FAQ

Call us Call us

Reception:

Phone: (+45) 33 36 71 00
Fax: (+45) 33 36 71 99


next
previous
items

Skip to content. | Skip to navigation

Sound and independent information
on the environment

You are here: Home / Data and maps / Maps and graphs / Share of surface transport modes in 2000

Share of surface transport modes in 2000

Created : Nov 12, 2009 Published : Jan 01, 2002 Last modified : Nov 29, 2012 11:38 AM
Topics: ,
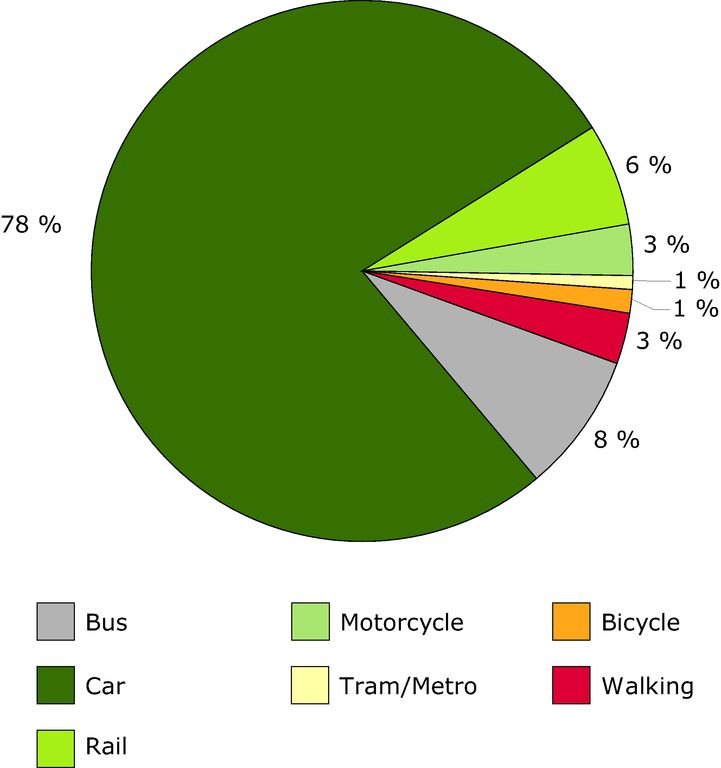
The figure shows the share of different surface transport modes in 2000, including the non-motorised modes
This is the latest published version. .

Download

European data

Metadata

Additional information

NB: Non-motorised modes combined are equivalent to about two thirds of the share for rail transport and, as such, make up a significant contribution to the modal split in urban areas.

Filed under:

Comments

European Environment Agency (EEA)
Kongens Nytorv 6
1050 Copenhagen K
Denmark
Phone: +45 3336 7100