Personal tools

Sign up now!
Get notifications on new reports and products. Currently we have 76894 subscribers. Frequency: 3-4 emails / month.
Follow us
Twitter icon Twitter
Facebook icon Facebook
YouTube icon YouTube channel
RSS logo RSS Feeds
Notifications archive

Write to us Write to us

For the public:


For media and journalists:

Contact EEA staff
Contact the web team
FAQ

Call us Call us

Reception:

Phone: (+45) 33 36 71 00
Fax: (+45) 33 36 71 99


next
previous
items

Skip to content. | Skip to navigation

Sound and independent information
on the environment

You are here: Home / Data and maps / Maps and graphs / Share of global exports

Share of global exports

Created : Dec 13, 2010 Published : Dec 14, 2010 Last modified : Nov 29, 2012 11:39 AM
Topics: ,
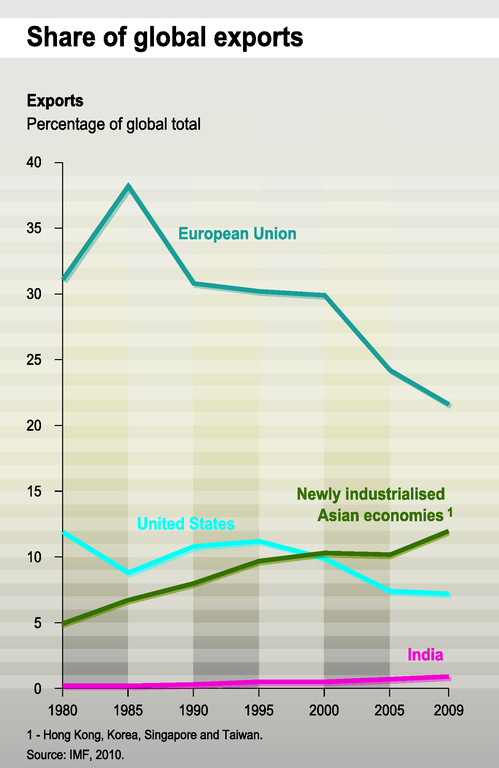
Share of world exports evolution (1980 to 2009) for selected export regions or countries
This is the latest published version. .

European data

Metadata

Additional information

This graph covers the European Union, United States, Newly Industrialised Asian Economies (Hong Kong, Korea, Singapore and Taiwan), India

European Environment Agency (EEA)
Kongens Nytorv 6
1050 Copenhagen K
Denmark
Phone: +45 3336 7100