All official European Union website addresses are in the europa.eu domain.
See all EU institutions and bodiesAn official website of the European Union | How do you know?
Environmental information systems
EN
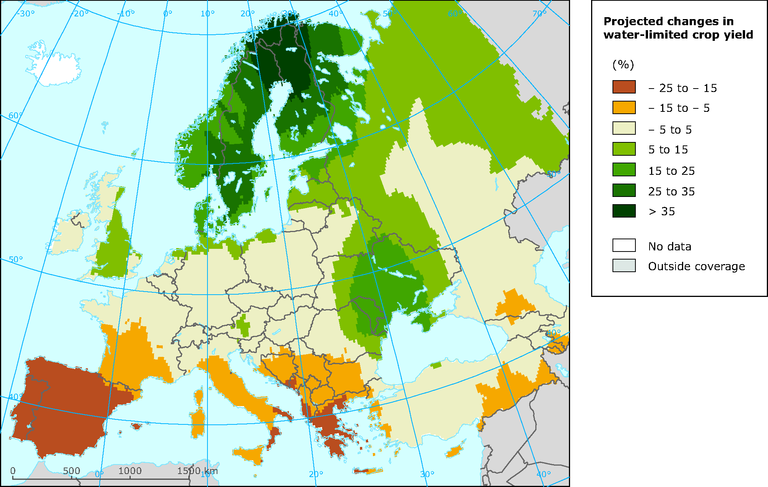
This map provides an aggregated picture of expected changes in crop yields across Europe for the 2050s (compared with 1961–1990). The simulations by the ClimateCrop model are based on an ensemble of 12 GCMs under the A1B emission scenario. They include effects of changes in temperature, precipitation and CO2 concentration on crop yields of three main crops assuming current irrigated area.
Loading