Personal tools

Sign up now!
Get notifications on new reports and products. Currently we have 60894 subscribers. Frequency: 3-4 emails / month.
Follow us
Twitter icon Twitter
Facebook icon Facebook
YouTube icon YouTube channel
RSS logo RSS Feeds
Notifications archive

Write to us Write to us

For the public:


For media and journalists:

Contact EEA staff
Contact the web team
FAQ

Call us Call us

Reception:

Phone: (+45) 33 36 71 00
Fax: (+45) 33 36 71 99


next
previous
items

Skip to content. | Skip to navigation

Sound and independent information
on the environment

You are here: Home / Data and maps / Maps and graphs / Past and projected EU-15 greenhouse gas emissions compared with Kyoto target for 2008-2012

Past and projected EU-15 greenhouse gas emissions compared with Kyoto target for 2008-2012

Created : Nov 12, 2009 Published : Jan 28, 2009 Last modified : Nov 29, 2012 11:41 AM
Topics: ,
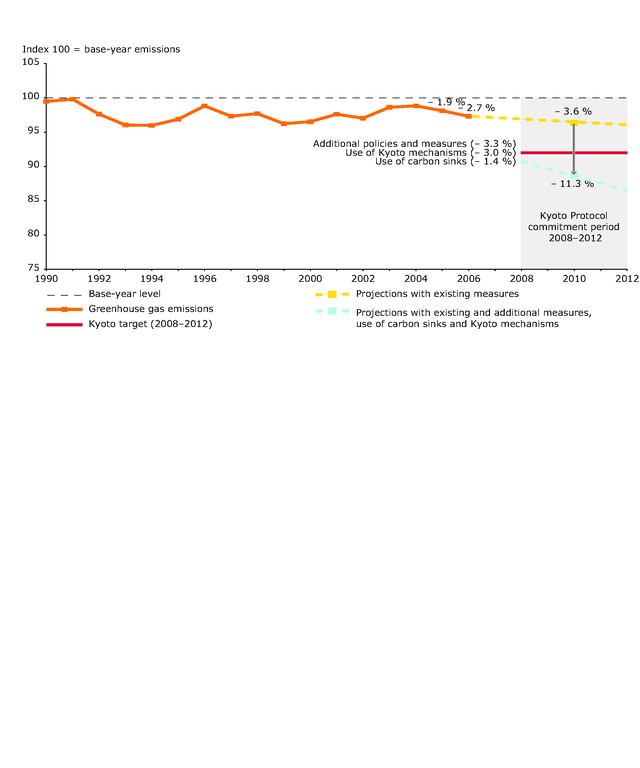
2010 projections from Denmark and Luxembourg correspond to average projections for the whole 20082012 period
This is the latest published version. .

Download

Metadata

Additional information

For the other Member States, this figure relies on the optimistic assumption that decreasing trends between 2005 and 2010 are maintained until 2012. It relies also on the fact that over-delivery of emission reductions by some Member States is not used for international emission trading outside the EU-15.

Comments

European Environment Agency (EEA)
Kongens Nytorv 6
1050 Copenhagen K
Denmark
Phone: +45 3336 7100