All official European Union website addresses are in the europa.eu domain.
See all EU institutions and bodiesAn official website of the European Union | How do you know?
Environmental information systems
EN
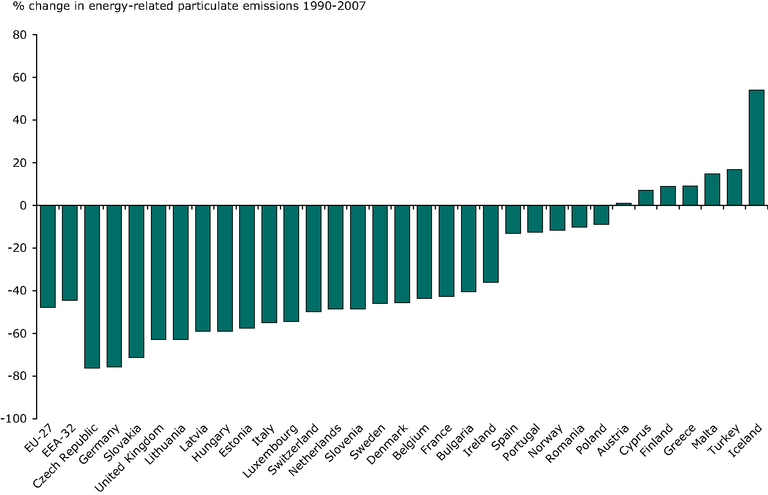
The graph shows the change in emissions of primary PM10 data, and emissions of secondary PM10 precursors (SO2 and NOx and NH3) each weighted using aerosol formation factors (according to de Leeuw, 2002) NOx = 0.88, SO2 = 0.54 and NH3 = 0.64.
Loading