Personal tools

Sign up now!
Get notifications on new reports and products. Currently we have 56085 subscribers. Frequency: 3-4 emails / month.
Follow us
Twitter icon Twitter
Facebook icon Facebook
YouTube icon YouTube channel
RSS logo RSS Feeds
Notifications archive

Write to us Write to us

For the public:


For media and journalists:

Contact EEA staff
Contact the web team
FAQ

Call us Call us

Reception:

Phone: (+45) 33 36 71 00
Fax: (+45) 33 36 71 99


next
previous
items

Skip to content. | Skip to navigation

Sound and independent information
on the environment

You are here: Home / Data and maps / Maps and graphs / NO2 in cities, 2000

NO2 in cities, 2000

Created : Nov 12, 2009 Published : Jan 01, 2002 Last modified : Nov 29, 2012 11:41 AM
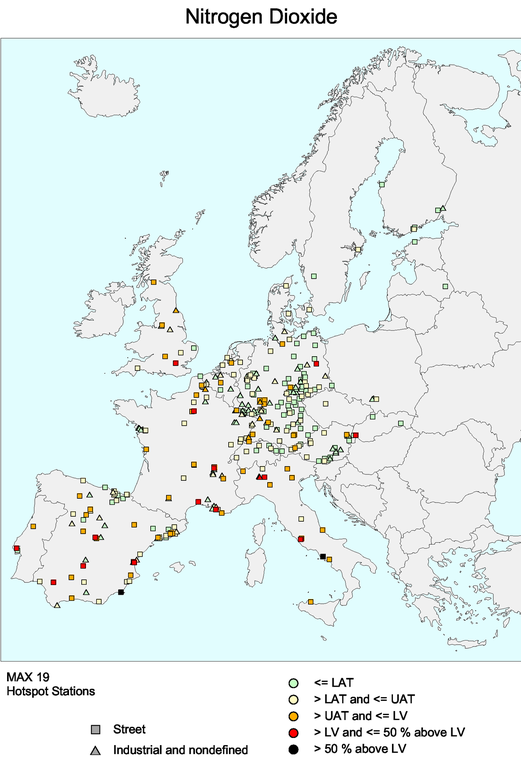
Hot-spot stations, 19th highest hourly value

Download

Metadata

Additional information

The maximum UB station in each city with data, relative to EU limit value (LV) and upper and lower assessment thresholds (UAT, LAT). LV: 200 µg/m3, UAT: 140 µg/m3, LAT: 100 µg/m3.

Related content

Filed under: ,
European Environment Agency (EEA)
Kongens Nytorv 6
1050 Copenhagen K
Denmark
Phone: +45 3336 7100