All official European Union website addresses are in the europa.eu domain.
See all EU institutions and bodiesAn official website of the European Union | How do you know?
Environmental information systems
EN
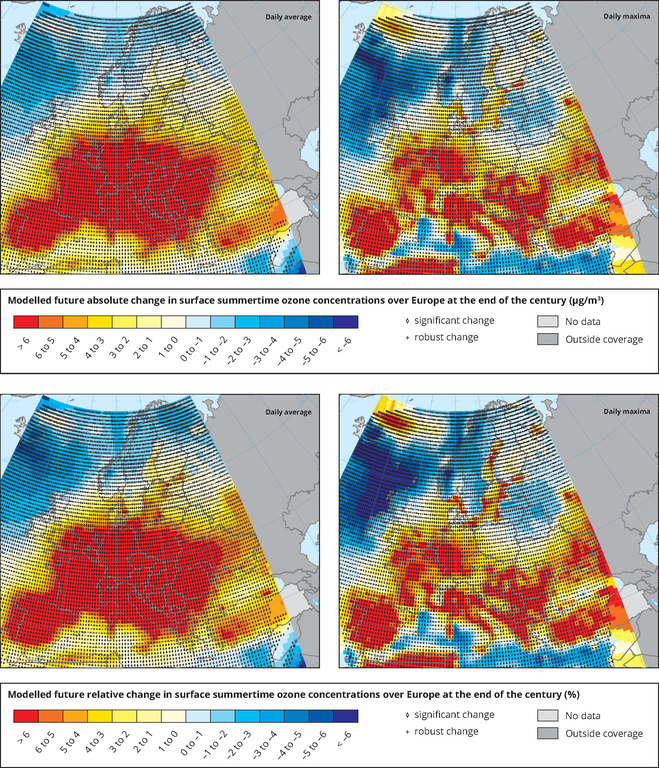
Absolute and relative difference between future (2071-2100) and present (1960-2010) summertime average daily and maxima ozone levels in a 3 model ensemble. The modelled changes shown are only due to climate variability and climate change. A diamond sign is plotted where the change is significant, and a plus sign is added where the change is robust across two-third of modelled years.
The period 2071-2100 is taken as representative of the end of the 21st century (2100)
Loading