Personal tools

Sign up now!
Get notifications on new reports and products. Currently we have 75997 subscribers. Frequency: 3-4 emails / month.
Follow us
Twitter icon Twitter
Facebook icon Facebook
YouTube icon YouTube channel
RSS logo RSS Feeds
Notifications archive

Write to us Write to us

For the public:


For media and journalists:

Contact EEA staff
Contact the web team
FAQ

Call us Call us

Reception:

Phone: (+45) 33 36 71 00
Fax: (+45) 33 36 71 99


next
previous
items

Skip to content. | Skip to navigation

Sound and independent information
on the environment

You are here: Home / Data and maps / Maps and graphs / Model simulation of hydrodynamics and phytoplankton dynamics during three contrasting summers in Lake Nieuwe Meer (the Netherlands)

Model simulation of hydrodynamics and phytoplankton dynamics during three contrasting summers in Lake Nieuwe Meer (the Netherlands)

Created : Nov 12, 2009 Published : Oct 23, 2008 Last modified : Nov 29, 2012 11:39 AM
Topics: ,
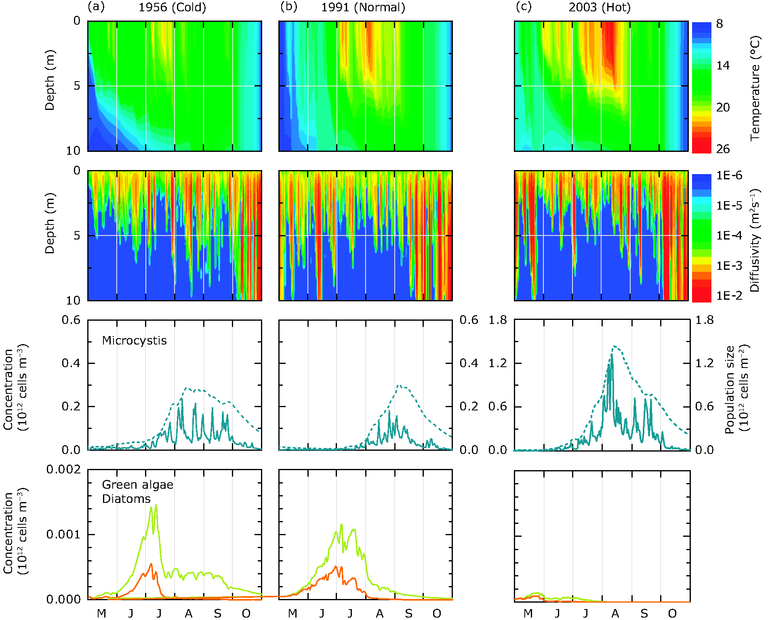
(a) the cold summer of 1956, (b) the average summer of 1991, and, (c) the hot summer of 2003
This is the latest published version. .

Download

Metadata

Additional information

Top panels show the temperature contour plots. The second row shows contour plots of the turbulent diffusivities. The third row shows the surface concentrations of Microcystis (solid lines) and the depth-integrated population size of Microcystis (dashed lines). The fourth row shows the surface concentrations of diatoms (orange lines) and green algae (green lines). Note the difference in scale between the Microcystis concentrations (third row) and the concentrations of diatoms and green algae (fourth row).

Comments

European Environment Agency (EEA)
Kongens Nytorv 6
1050 Copenhagen K
Denmark
Phone: +45 3336 7100