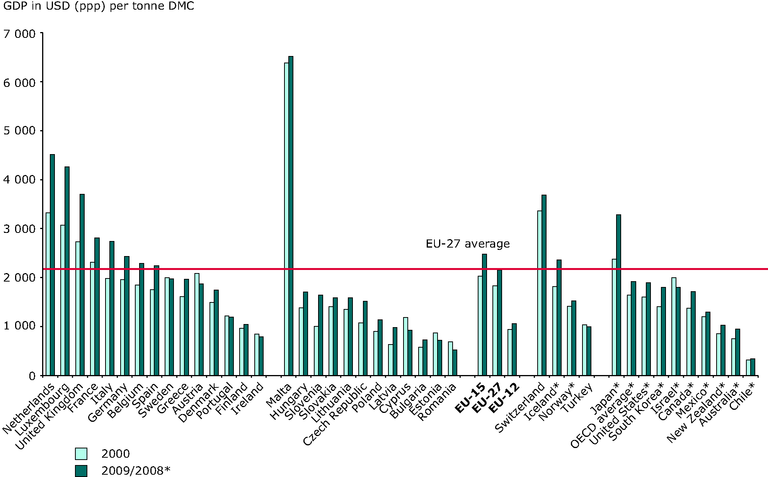
This figure shows the material productivity (GDP in millions of 2011 US$ (converted to 2011 price level with updated 2005 EKS PPPs) per tonnes DMC) for the EU27 member states and selected other countries in 2000 and 2009 respectively 2008.
The methodology for the calculation of DMI / DMC was revised by Eurostat in 2007. For Fig. 4, the data are calculated after the revised methodology. Therefore, the data set compromises the consistency in order to provide an extended temporal coverage. For non-EU countries, we used the MFA data compiled by the Wuppertal Institute on behalf of OECD (not published yet).
Units:
GDP in millions of 2011 US$ (converted to 2011 price level with updated 2005 EKS PPPs per ton DMC
Rights:
EEA standard re-use policy: unless otherwise indicated, re-use of content on the EEA website for commercial or non-commercial purposes is permitted free of charge, provided that the source is acknowledged (http://www.eea.europa.eu/legal/copyright). Copyright holder: Wuppertal institute for climate, Environment and energy.
The data are taken from external data bases (DMC from Eurostat and WI database, population from Eurostat and The Conference Board Total Economy Database).
Geographical coverage include Japan, United States, South Korea, Israel, Canada, Mexico, New Zealand, Australia and Chile
Document Actions
Share with others