All official European Union website addresses are in the europa.eu domain.
See all EU institutions and bodiesAn official website of the European Union | How do you know?
Environmental information systems
EN
- БългарскиBG
- češtinaCS
- HrvatskiHR
- danskDA
- NederlandsNL
- ελληνικάEL
- EnglishEN
- eestiET
- SuomiFI
- FrançaisFR
- DeutschDE
- magyarHU
- ÍslenskaIS
- italianoIT
- LatviešuLV
- lietuviųLT
- MaltiMT
- NorskNO
- polskiPL
- PortuguêsPT
- RomânăRO
- slovenčinaSK
- SlovenščinaSL
- EspañolES
- SvenskaSV
- TürkçeTR
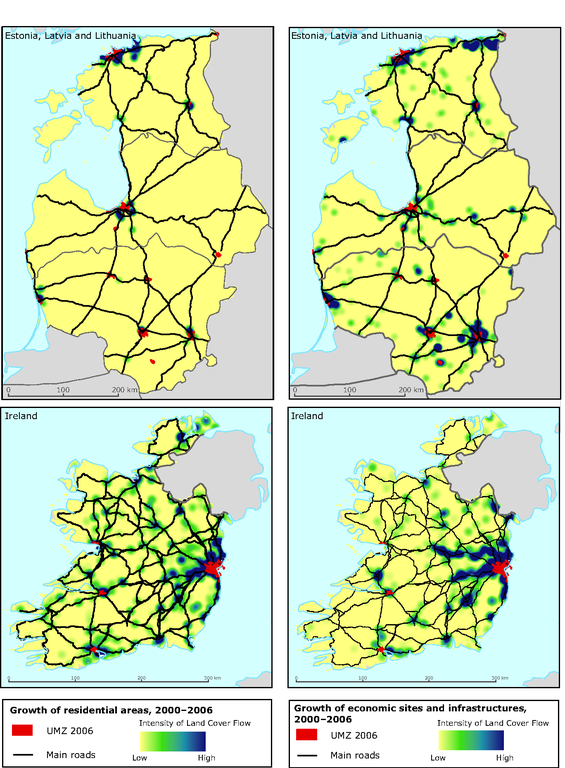
Intensity of urban sprawl 2000–2006 in Estonia, Latvia and Lithuania (above) and Ireland (below)
Map (static)
-
Downloads
Data sources
Metadata
More info
Loading
Estonia, Ireland, Latvia, Lithuania
2000-2006
The areas surrounding the main road transport links were analysed for increase in urban land cover. The intensity of urban sprawl is the percentage of the total area changed that is transformed to points and estimated as density within a search radius of 10 km. The map also shows the main road axes and urban areas