Personal tools

Sign up now!
Get notifications on new reports and products. Currently we have 57129 subscribers. Frequency: 3-4 emails / month.
Follow us
Twitter icon Twitter
Facebook icon Facebook
YouTube icon YouTube channel
RSS logo RSS Feeds
Notifications archive

Write to us Write to us

For the public:


For media and journalists:

Contact EEA staff
Contact the web team
FAQ

Call us Call us

Reception:

Phone: (+45) 33 36 71 00
Fax: (+45) 33 36 71 99


next
previous
items

Skip to content. | Skip to navigation

Sound and independent information
on the environment

You are here: Home / Data and maps / Maps and graphs / Growth in the Productivity of Labour, Energy and Materials in the EU

Growth in the Productivity of Labour, Energy and Materials in the EU

Created : Jun 07, 2012 Published : Aug 21, 2012 Last modified : Nov 29, 2012 11:37 AM
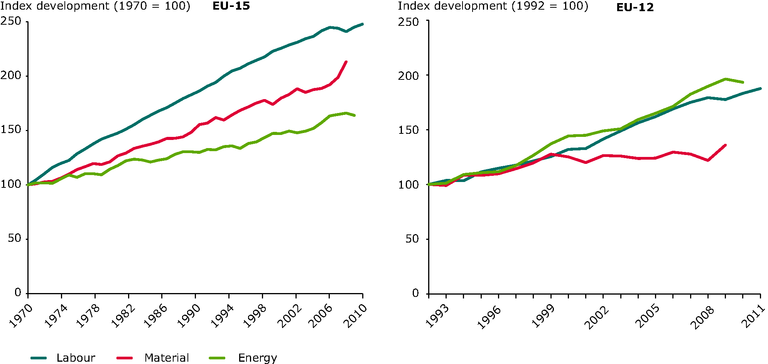
This figure shows the development of labour productivity, energy productivity and materials productivity in the EU

Download

European data

Metadata

Additional information

The data are taken from external data bases: GDP in millions of 2011 US$ (converted to 2011 price level with updated 2005 EKS PPPs) and labour hours from Total Economy Database, DMC from Eurostat, IFF database and WI database, Total primary energy supply from the Energy Balances of the IEA database, since 1990: Energy data are taken from Eurostat.

European Environment Agency (EEA)
Kongens Nytorv 6
1050 Copenhagen K
Denmark
Phone: +45 3336 7100