Personal tools

Sign up now!
Get notifications on new reports and products. Currently we have 57713 subscribers. Frequency: 3-4 emails / month.
Follow us
Twitter icon Twitter
Facebook icon Facebook
YouTube icon YouTube channel
RSS logo RSS Feeds
Notifications archive

Write to us Write to us

For the public:


For media and journalists:

Contact EEA staff
Contact the web team
FAQ

Call us Call us

Reception:

Phone: (+45) 33 36 71 00
Fax: (+45) 33 36 71 99


next
previous
items

Skip to content. | Skip to navigation

Sound and independent information
on the environment

You are here: Home / Data and maps / Maps and graphs / GHG emission intensity of European economies (GHG emissions per GDP) in 2008 and changes in economic intensity, 1990–2008

GHG emission intensity of European economies (GHG emissions per GDP) in 2008 and changes in economic intensity, 1990–2008

Created : Oct 21, 2011 Published : Dec 09, 2011 Last modified : Nov 29, 2012 11:38 AM
Topics: ,
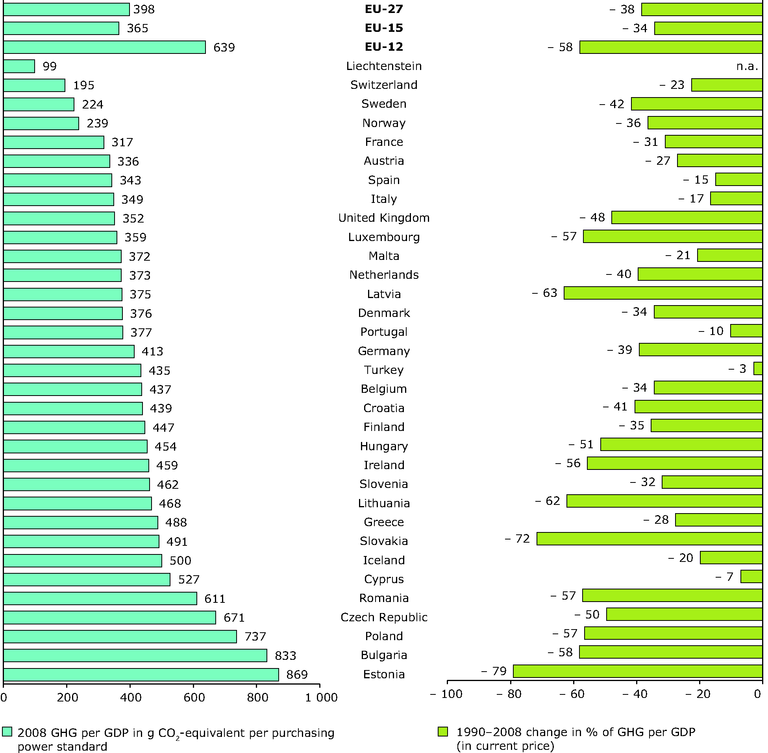
The left graph uses GDP at market prices, current prices, converted to PPS (purchasing power standard), which allows meaningful volume comparisons of GDP across European countries and benchmark country performance in a particular year. The right graph refers to GDP at constant market prices, which allows consistent GDP time series in a particular country.
This is the latest published version. .

Download

Documents

Metadata

European Environment Agency (EEA)
Kongens Nytorv 6
1050 Copenhagen K
Denmark
Phone: +45 3336 7100