All official European Union website addresses are in the europa.eu domain.
See all EU institutions and bodies
An official website of the European Union | How do you know?
Environmental information systems
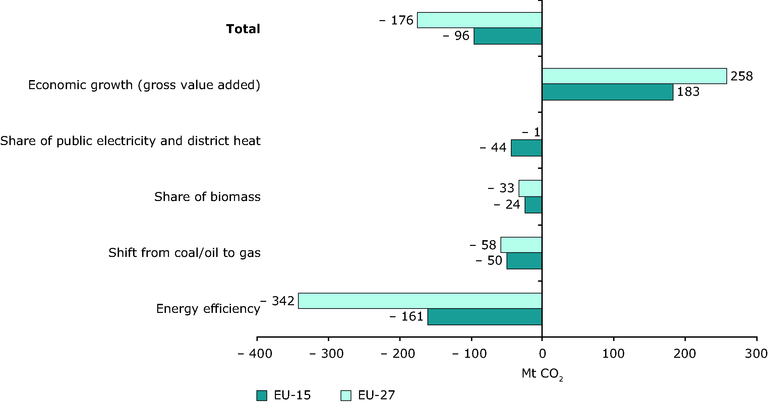
Main drivers of CO2 emission trends from manufacturing and construction industries in the EU‑27 and EU‑15, 1990–2007
Chart (static)
Main drivers of CO2 emission trends from manufacturing and construction industries in the EU‑27 and EU‑15, 1990–2007
Downloads
Data sources
Metadata
More info
Loading
- Austria
- Belgium
- Bulgaria
- Cyprus
- Czechia
- Denmark
- Estonia
- Finland
- France
- Germany
- Greece
- Hungary
- Ireland
- Italy
- Latvia
- Lithuania
- Luxembourg
- Malta
- Netherlands
- Poland
- Portugal
- Romania
- Slovakia
- Slovenia
- Spain
- Sweden
- United Kingdom
1990-2007
The bars with positive values indicate factors that cause an increase in emissions; the bars with negative values indicate factors that have a reducing effect.Aggregating all five effects provides the actual emission changes.'Economic growth' relates to the growth in manufacturing industry, measured in change of gross value added.'Share of public electricity and district heat' describes the effect resulting from changes in the share of public electricity and district heat in total final energy consumption. Consumption of public electricity and consumption of heat by industry or households cause emissions that are accounted for by the sector public electricity and heat production.'Share of biomass' describes the effect resulting from changes in the share of biomass used in total fuel use.'Shift from coal/oil to gas' describes the effect resulting from the shift to less-carbon-intensive fossil fuels in public power plants. 'Energy efficiency' describes the effect resulting from changes in final energy consumption (including electricity and district heating) per unit of gross value added (EUR million).