Personal tools

Sign up now!
Get notifications on new reports and products. Currently we have 60551 subscribers. Frequency: 3-4 emails / month.
Follow us
Twitter icon Twitter
Facebook icon Facebook
YouTube icon YouTube channel
RSS logo RSS Feeds
Notifications archive

Write to us Write to us

For the public:


For media and journalists:

Contact EEA staff
Contact the web team
FAQ

Call us Call us

Reception:

Phone: (+45) 33 36 71 00
Fax: (+45) 33 36 71 99


next
previous
items

Skip to content. | Skip to navigation

Sound and independent information
on the environment

You are here: Home / Data and maps / Maps and graphs / Example illustrating the relationship between effective mesh size and effective

Example illustrating the relationship between effective mesh size and effective

Created : Sep 23, 2011 Published : Sep 23, 2011 Last modified : Nov 29, 2012 11:38 AM
Topics: ,
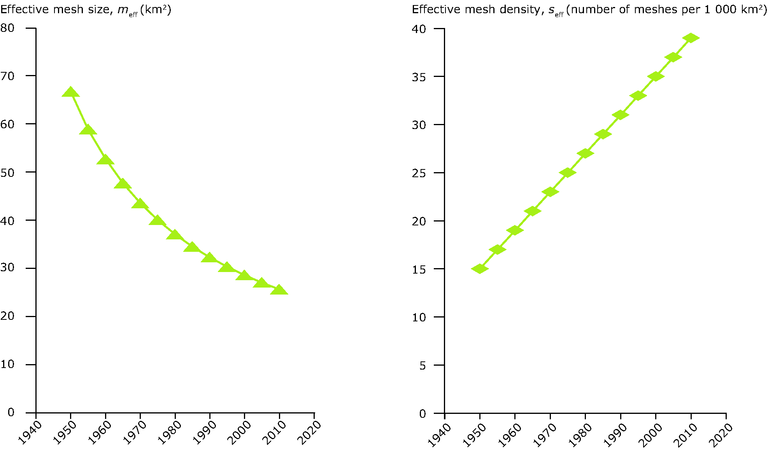
In this hypothetical example, the trend remains constant. A linear rise in effective mesh density (right) corresponds to a 1/x curve in the graph of the effective mesh size (left). A slower increase in fragmentation results in a flatter curve for effective mesh size, and a more rapid increase produces a steeper curve. It is therefore easier to read trends off the graph of effective mesh density (right).
This is the latest published version. .

Download

Documents

Metadata

Related content

European Environment Agency (EEA)
Kongens Nytorv 6
1050 Copenhagen K
Denmark
Phone: +45 3336 7100