Personal tools

Sign up now!
Get notifications on new reports and products. Currently we have 59922 subscribers. Frequency: 3-4 emails / month.
Follow us
Twitter icon Twitter
Facebook icon Facebook
YouTube icon YouTube channel
RSS logo RSS Feeds
Notifications archive

Write to us Write to us

For the public:


For media and journalists:

Contact EEA staff
Contact the web team
FAQ

Call us Call us

Reception:

Phone: (+45) 33 36 71 00
Fax: (+45) 33 36 71 99


next
previous
items

Skip to content. | Skip to navigation

Sound and independent information
on the environment

You are here: Home / Data and maps / Maps and graphs / Evolution of CO2 emissions from new passenger cars by fuel type

Evolution of CO2 emissions from new passenger cars by fuel type

Created : Apr 30, 2013 Published : Apr 30, 2013 Last modified : Apr 30, 2013 01:54 PM
Topics: , ,
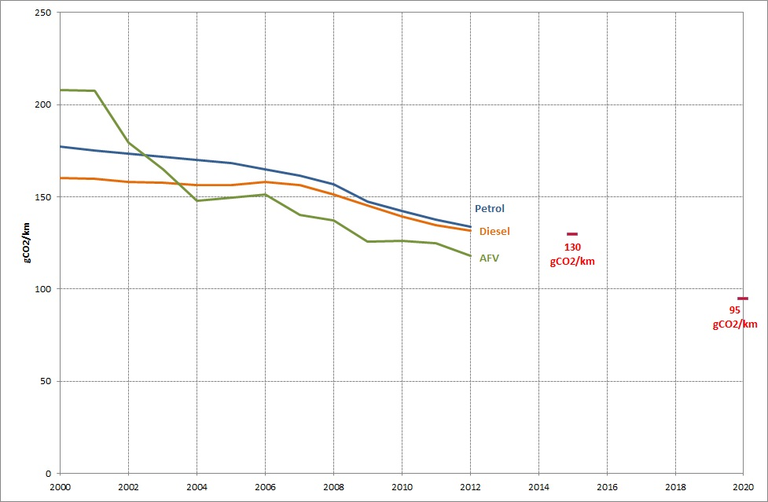
Graph showing progression of average emissions for new cars versus 2015 and 2020 targets

Download

Hard copy

European data

Metadata

Additional information

Data from 2000-2009 is compiled from DG-Clima monitoring

Data from 2010-2012 is from EEA monitoring for 2010-2012

The geographical scope of the data changes over time from the EU-15 to the EU-25 and the EU-27, see Annex 1 in report 'Monitoring CO2 emissions from new passenger cars in the EU' for details.

Related content

Comments

European Environment Agency (EEA)
Kongens Nytorv 6
1050 Copenhagen K
Denmark
Phone: +45 3336 7100