All official European Union website addresses are in the europa.eu domain.
See all EU institutions and bodies
An official website of the European Union | How do you know?
Environmental information systems
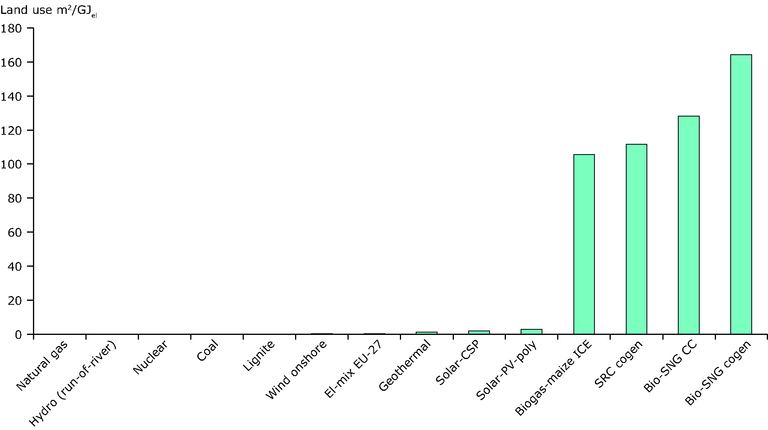
The graph illustrates that energy systems differ in the extent and complexity of their impacts by presenting the projected life cycle land use of fossil, nuclear and renewable electricity systems in 2030. To understand the implications of increased bioenergy production, it is important to recognise that the land used for energy cropping is a natural resource, comprising soil, minerals, water and biota. Where bioenergy involves energy cropping it often necessitates changes to land use, with significant implications for related systems as well Other renewable technologies do also use some land and so do fossil and nuclear systems but the area is comparatively small. Nevetheless these technologies have other limitations.
Loading