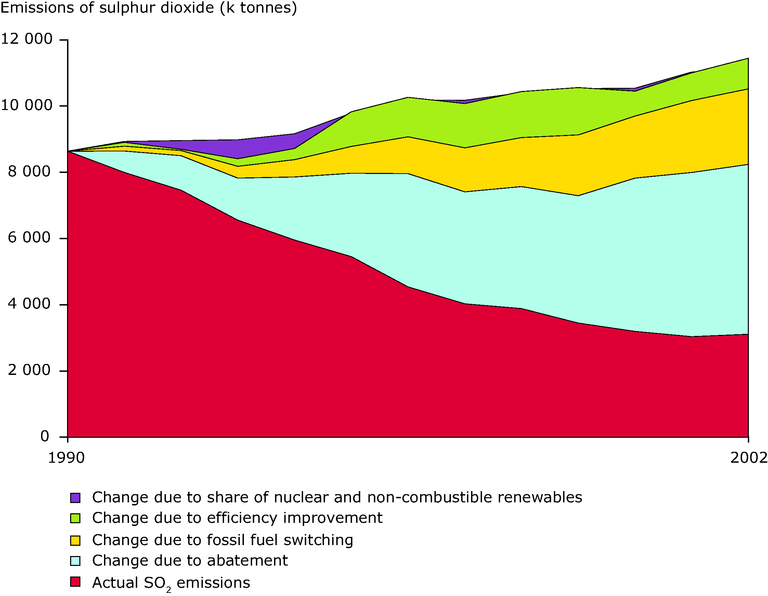
The chart shows the contributions of the various factors that have affected SO2 emissions from electricity and heat production. The top line represents the development of SO2 emissions that would have occurred due to increasing electricity production between 1990 and 2002, if the structure of electricity and heat production had remained unchanged from 1990 (i.e. if the shares of input fuels used to produce electricity and heat had remained constant, the efficiency of electricity and heat production also stayed the same and no additional abatement technologies had been introduced). However, there were a number of changes to the structure of electricity and heat production that tended to reduce SO2 emissions and the contributions of each of these changes to reducing emissions are shown by the shaded areas. The cumulative effect of all these changes was that SO2 emissions from electricity and heat production actually followed the trend shown by the dark black area at the bottom of the graph.