All official European Union website addresses are in the europa.eu domain.
See all EU institutions and bodiesAn official website of the European Union | How do you know?
Environmental information systems
EN
Left: year vs
Loading
All official European Union website addresses are in the europa.eu domain.
See all EU institutions and bodiesChart (static)
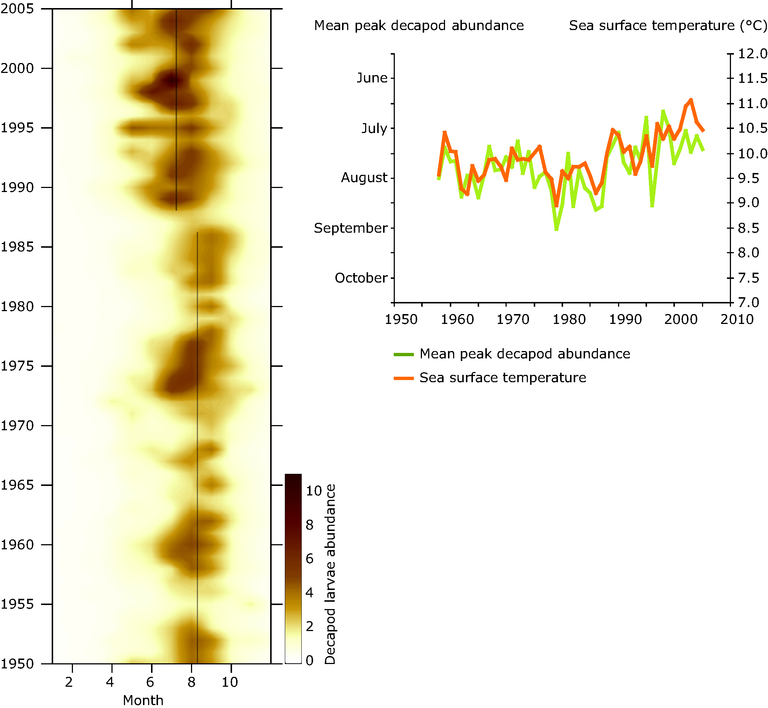
Left: year vs
month plot is highlighting the mean seasonal peak in the decapod abundance. Right: the month of seasonal peak of decapod larvae for each year 1958-2005 (green line) shown together with sea surface temperature (orange line).
Geographical coverage note: North Sea