Sign up now!
Get notifications on new reports and products. Currently we have 33697 subscribers. Frequency: 3-4 emails / month.
Follow us
Twitter icon Twitter
Facebook icon Facebook
YouTube icon YouTube channel
RSS logo RSS Feeds
Notifications archive

Write us Write to us

For the public:


For media and journalists:

Contact EEA staff
Contact the web team
FAQ

Call us Call us

Reception:

Phone:
(+45) 33 36 71 00
Fax: (+45) 33 36 71 99


RSS Upcoming environmental events around the world
ENREG ENERGIA REGENERABILA® 2012
300 Aurel Vlaicu Street, 310025 Arad, Romania, 25 May 2012 - 27 May 2012
32nd annual conference of IAIA: Energy Future - The Role of Impact Assessment
Edifício da Alfândega 4050-430, Porto, Portugal, 27 May 2012 - 01 Jun 2012
GMES conference
European Environment Agency, Kongens Nytorv 6, 1050, Copenhagen K, Denmark, 04 Jun 2012 - 05 Jun 2012
More
Submit a new event
You are here: Home Data and maps Maps and graphs Contribution to total change in PM10 emissions for each sector and pollutant between 1990 and 2009 (EEA member countries)
Personal tools

Contribution to total change in PM10 emissions for each sector and pollutant between 1990 and 2009 (EEA member countries)

Topics: ,
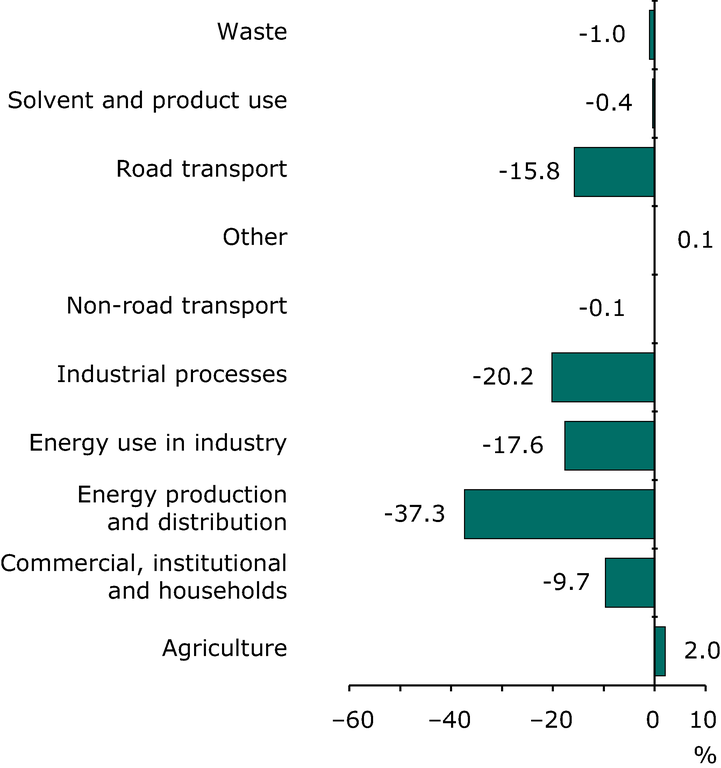
The contribution made by each sector to the total change in primary PM10 particulate matter emission between 1990 and 2009.
This is the latest published version. See older versions.

Additional information

'Contribution to change' plots show the contribution to the total emission change between 1990-2009 made by a specified sector/ pollutant. A negative value (-51%) indicates that this sector contributes to the total reduction in emissions of acidifying substances (by 51%). A positive value indicates an increase in emission in this sector and a negative impact on the total reduction in emissions.

Data for Greece, Iceland, Luxembourg and Turkey not available.

 
Document Actions
European Environment Agency (EEA)
Kongens Nytorv 6, 1050, Copenhagen K, Denmark.
Phone: +45 3336 7100