All official European Union website addresses are in the europa.eu domain.
See all EU institutions and bodiesAn official website of the European Union | How do you know?
Environmental information systems
EN
- БългарскиBG
- češtinaCS
- HrvatskiHR
- danskDA
- NederlandsNL
- ελληνικάEL
- EnglishEN
- eestiET
- SuomiFI
- FrançaisFR
- DeutschDE
- magyarHU
- ÍslenskaIS
- italianoIT
- LatviešuLV
- lietuviųLT
- MaltiMT
- NorskNO
- polskiPL
- PortuguêsPT
- RomânăRO
- slovenčinaSK
- SlovenščinaSL
- EspañolES
- SvenskaSV
- TürkçeTR
Contribution to total change in carbon monoxide emissions for each sector
Chart (static)
Shares are expressed in %
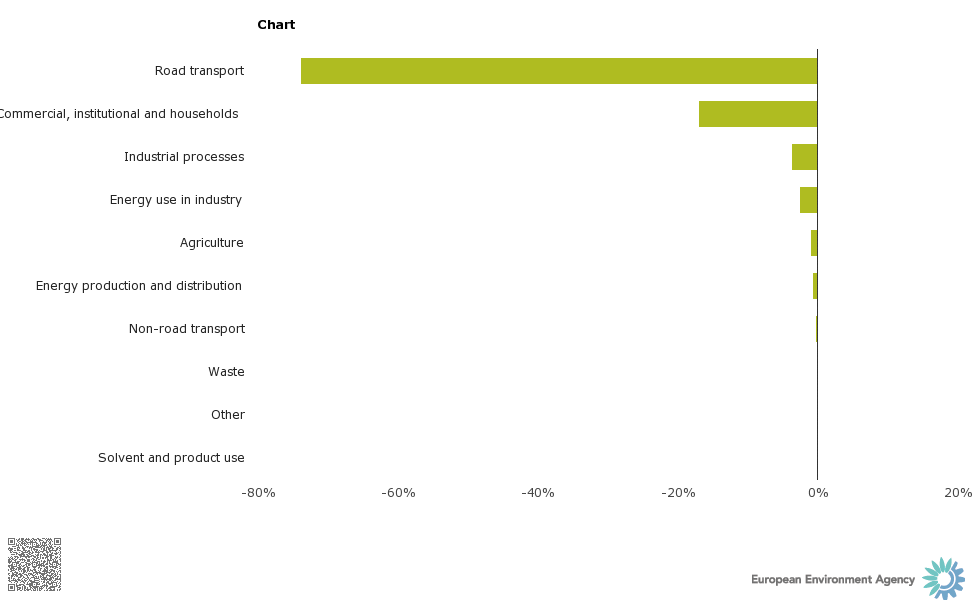
Contribution to change' plots show the contribution to the total emission change between 1990-2011 made by a specified sector/ pollutant. A negative value (-51%) indicates that this sector contributes to the total reduction in emissions of ozone-precursor substances (by 51%). A positive value indicates an increase in emission in this sector and a negative impact on the total reduction in emissions.
Downloads
Data sources
Metadata
More info
- National emissions reported to the Convention on Long-range Transboundary Air Pollution (LRTAP Convention), European Environment Agency (EEA)
- Austria
- Belgium
- Bulgaria
- Croatia
- Cyprus
- Czechia
- Denmark
- Estonia
- Finland
- France
- Germany
- Greece
- Hungary
- Iceland
- Ireland
- Italy
- Latvia
- Liechtenstein
- Lithuania
- Luxembourg
- Malta
- Netherlands
- Norway
- Poland
- Portugal
- Romania
- Slovakia
- Slovenia
- Spain
- Sweden
- Switzerland
- United Kingdom
1990-2011