next
previous
items

Figure

Contribution of different sectors (energy and non-energy) to total emissions of SO2, NOx, NH3, 2008, EEA-32

Figure Created 07 Jul 2011 Published 12 Aug 2011 Last modified 26 Aug 2017
1 min read
This is an old version, kept for reference only.

Go to latest version
Topics:
This page was archived on 26 Aug 2017 with reason: A new version has been published
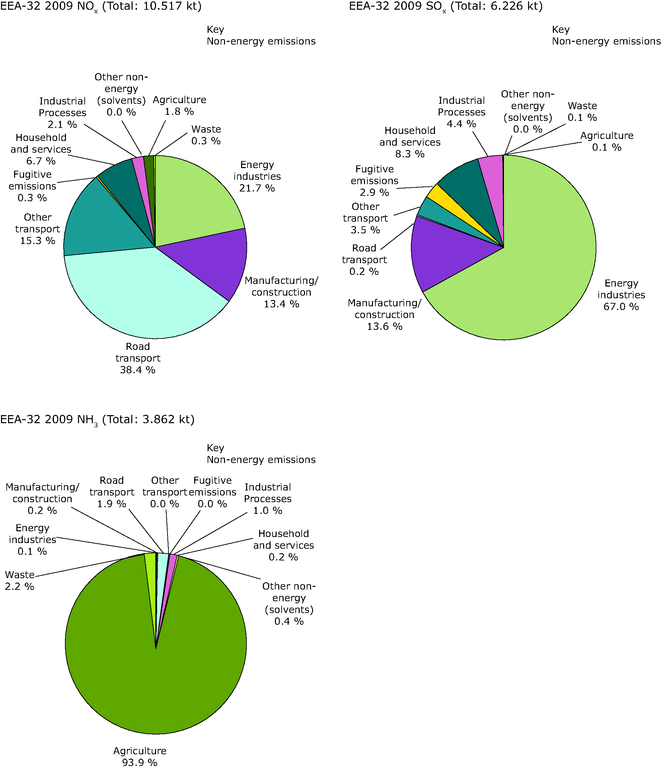
The figue shows the contribution of different sectors (energy and non-energy) to total emissions of SO2, NOx, NH3, 2008, EEA-32

Download

Documents

European data

Metadata

Additional information

The emissions of sulphur dioxide SO2, nitrogen oxides NOx and ammonia NH3

Permalinks

Geographic coverage

Temporal coverage

Topics

Topics:

Tags

Filed under:
Filed under: energy, emissions, pollutants
Document Actions