All official European Union website addresses are in the europa.eu domain.
See all EU institutions and bodiesAn official website of the European Union | How do you know?
Environmental information systems
EN
- БългарскиBG
- češtinaCS
- HrvatskiHR
- danskDA
- NederlandsNL
- ελληνικάEL
- EnglishEN
- eestiET
- SuomiFI
- FrançaisFR
- DeutschDE
- magyarHU
- ÍslenskaIS
- italianoIT
- LatviešuLV
- lietuviųLT
- MaltiMT
- NorskNO
- polskiPL
- PortuguêsPT
- RomânăRO
- slovenčinaSK
- SlovenščinaSL
- EspañolES
- SvenskaSV
- TürkçeTR
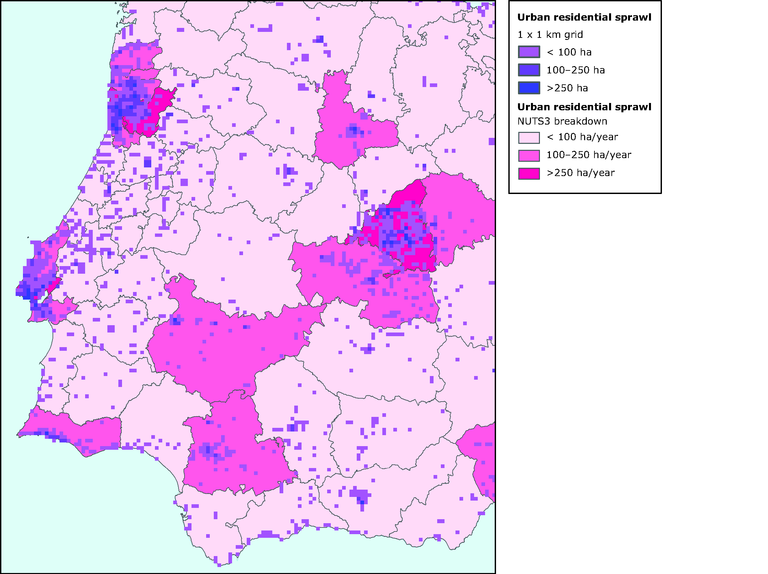
Comparison of urban residential sprawl spatial distribution, by administrative regions and by grid-cells
Map (static)
Urban residential sprawl, i.e
Downloads
Data sources
Metadata
More info
Loading
The European Topic Centre on Land Use and Spatial Information
Methodology
Applied procedures: Map showing values for urban residential sprawl 1990-2000 (LCF2) computed according to a regional breakdown based on administrative units (NUTS 3) and an accounting grid at 1 km x 1 km resolution for southern Portugal and southwest Spain. Only those cells of the accounting grid that show urban residential sprawl are shown. The legend indicating the extent of residential urban sprawl in each unit is common to the two ways of mapping the land cover flow.