Personal tools

Sign up now!
Get notifications on new reports and products. Currently we have 75963 subscribers. Frequency: 3-4 emails / month.
Follow us
Twitter icon Twitter
Facebook icon Facebook
YouTube icon YouTube channel
RSS logo RSS Feeds
Notifications archive

Write to us Write to us

For the public:


For media and journalists:

Contact EEA staff
Contact the web team
FAQ

Call us Call us

Reception:

Phone: (+45) 33 36 71 00
Fax: (+45) 33 36 71 99


next
previous
items

Skip to content. | Skip to navigation

Sound and independent information
on the environment

You are here: Home / Data and maps / Maps and graphs / Comparison of 2005 EU-15 emissions with hypothetical target paths towards the EU-15 Kyoto target

Comparison of 2005 EU-15 emissions with hypothetical target paths towards the EU-15 Kyoto target

Created : Nov 12, 2009 Published : Dec 04, 2007 Last modified : Nov 29, 2012 11:42 AM
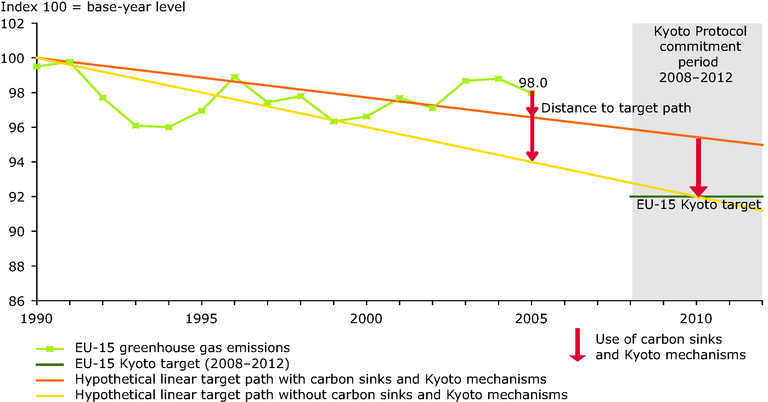
The Kyoto mechanisms are projected to account for 2.5 % of the EUtarget of an 8 % reduction, and the carbon sink activities are projected to contribute to an additional 0.9 %
This is the latest published version. .

Download

Metadata

Additional information

Thus, both hypothetical linear target paths presented here start at 100 in 1990, but in 2010 one reaches 92.0 while the other reaches 92.0 + 3.4. For more information on Kyoto mechanisms and carbon sinks, see Chapters 7 and 9.

Related content

Comments

European Environment Agency (EEA)
Kongens Nytorv 6
1050 Copenhagen K
Denmark
Phone: +45 3336 7100