All official European Union website addresses are in the europa.eu domain.
See all EU institutions and bodiesAn official website of the European Union | How do you know?
Environmental information systems
EN
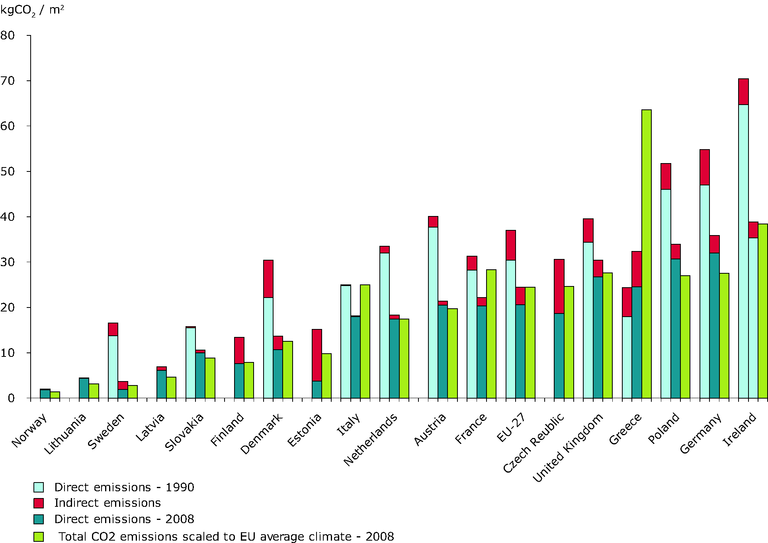
The graph compares by country the level of CO2 emissions for space heating per m2 for 2 years : 1990 and 2008 (direct and indirect emissions).
1990 and 2008 data are climate corrected against each country’s long-term average climate, whereas the last series is climate corrected and scaled against the EU long-term average climate to account for temperature differences between countries.
Loading