All official European Union website addresses are in the europa.eu domain.
See all EU institutions and bodies
An official website of the European Union | How do you know?
Environmental information systems
EN

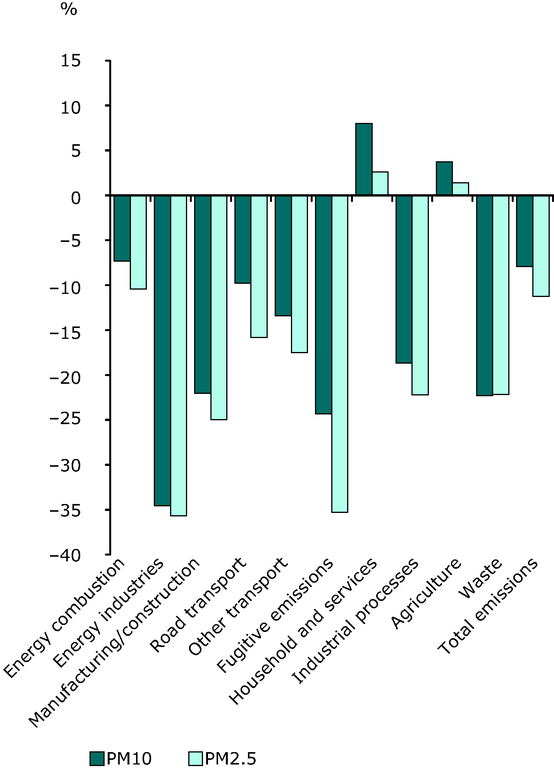
‘Energy combustion’ includes all energy-related emissions minus fugitives the graph shows the emissions of PM10 and PM2.5 (particulate matter with a diameter of 10 μm or less, emitted directly into the atmosphere)
Loading