All official European Union website addresses are in the europa.eu domain.
See all EU institutions and bodiesAn official website of the European Union | How do you know?
Environmental information systems
EN
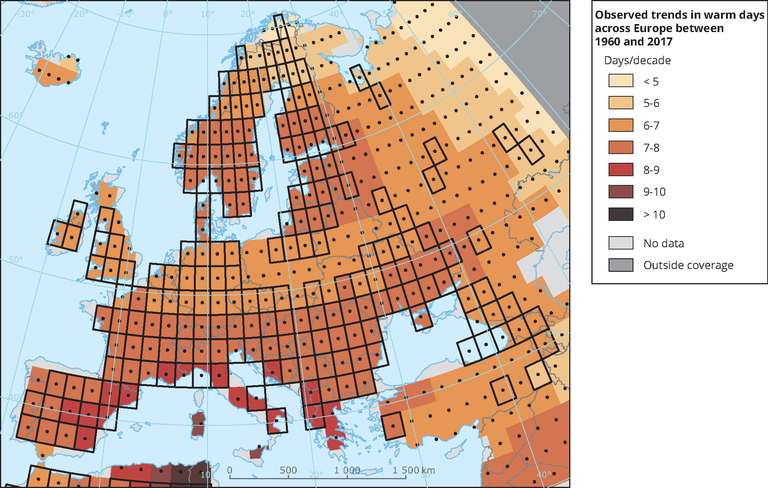
Warm days are defined as being above the 90th percentile of the daily maximum temperature.
Boxes outlined in solid black contain at least three stations and so are likely to be more representative of the entire grid. A significant (at the 5 % level) long-term trend is shown by a black dot.
Loading