All official European Union website addresses are in the europa.eu domain.
See all EU institutions and bodiesAn official website of the European Union | How do you know?
Environmental information systems
EN
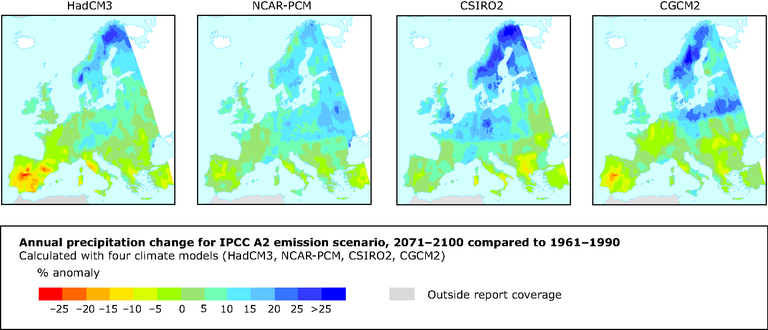
The map shows for 4 different climate models the projected changes in annual precipitation, based on the IPCC A2 baseline scenario
Loading