Personal tools

Sign up now!
Get notifications on new reports and products. Currently we have 56557 subscribers. Frequency: 3-4 emails / month.
Follow us
Twitter icon Twitter
Facebook icon Facebook
YouTube icon YouTube channel
RSS logo RSS Feeds
Notifications archive

Write to us Write to us

For the public:


For media and journalists:

Contact EEA staff
Contact the web team
FAQ

Call us Call us

Reception:

Phone: (+45) 33 36 71 00
Fax: (+45) 33 36 71 99


next
previous
items

Skip to content. | Skip to navigation

Sound and independent information
on the environment

You are here: Home / Data and maps / Maps and graphs / Average annual concentrations of NO2 and PM10 in urban areas

Average annual concentrations of NO2 and PM10 in urban areas

Created : Nov 12, 2009 Published : Sep 04, 2007 Last modified : Nov 29, 2012 11:39 AM
Topics: ,
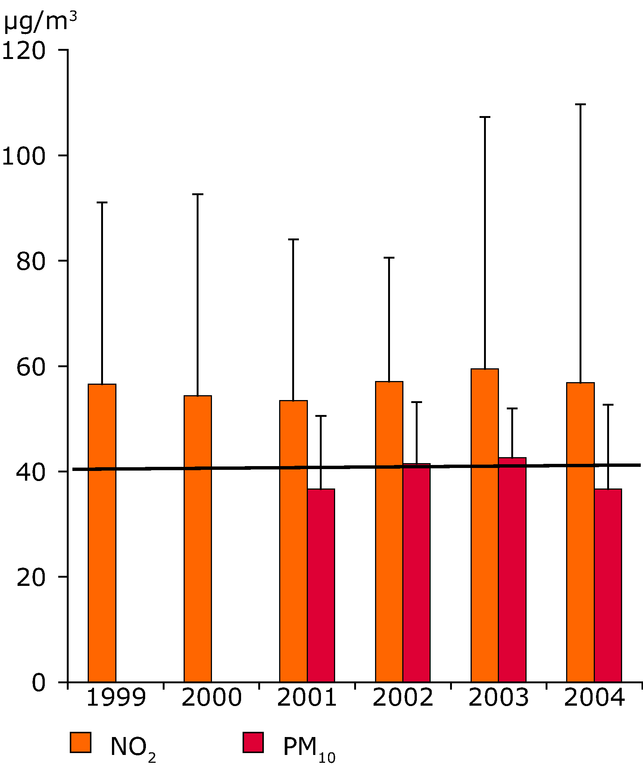
Bars represent average annual concentrations over a limited number of monitoring stations along busy roads in major European cities (Vienna, Bruxelles, Prague, Helsinki, Paris, Berlin, Athens, Krakow, Bratislava, Stockholm and London), error bars represent the highest annual concentration measured at one single monitoring station

Download

Metadata

Additional information

The dotted line represent the EU limit set for PM10 (2005) and NOX (2010).

Related content

Filed under: , ,
European Environment Agency (EEA)
Kongens Nytorv 6
1050 Copenhagen K
Denmark
Phone: +45 3336 7100