3.1 Current progress towards targets under the Effort Sharing Decision
In order to achieve the European Union’s (EU’s) objective of a 20 % reduction in total greenhouse gas (GHG) emissions by 2020, compared with 1990, the Effort Sharing Decision (ESD) (EU, 2009a) sets national targets for each Member State on GHG emissions not covered by the EU Emissions Trading System (ETS) (EU, 2009b). There are no national targets on GHG emissions that cover total (economy-wide) emissions. National ESD targets cover sectors such as transport, buildings, agriculture and waste management. Altogether, these sectors account for almost 60 % of total EU GHG emissions. Mitigation actions take place at national level, through a mix of EU-driven policies and measures and national initiatives. ESD targets range from 20 % reductions (Denmark, Ireland and Luxembourg) to 20 % allowed increases (Bulgaria), compared with 2005 base-year levels. Taken together, the aggregated ESD targets for 2020 represent a 9 % reduction at EU level compared with 2005 base-year levels. The ESD also sets annual binding targets for the 2013–2020 period, in order to monitor progress across the EU, allow for corrective action and ultimately ensure the attainment of the EU’s GHG emission target by 2020.
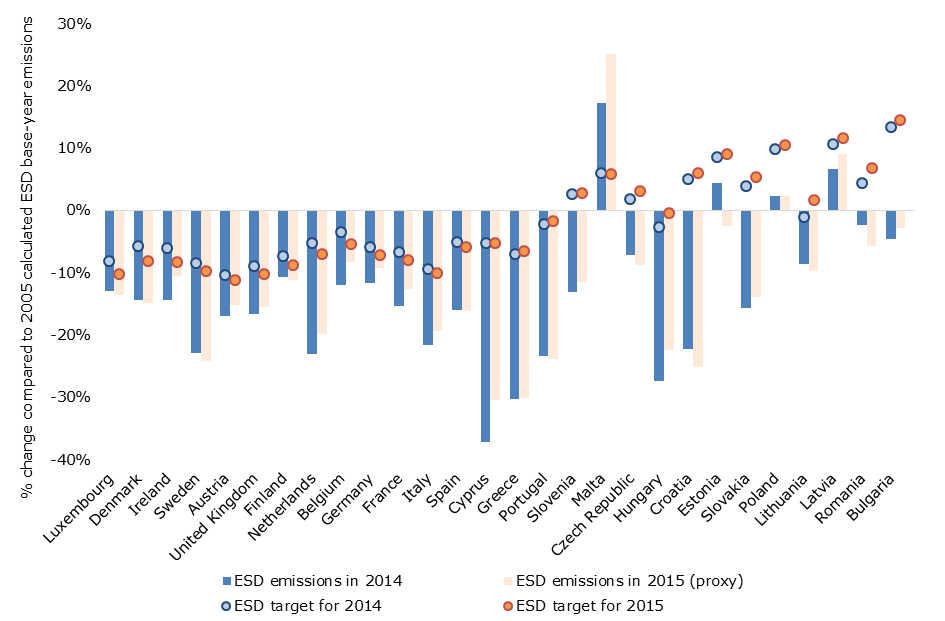
In 2014, all but one Member State exhibited ESD emissions that were below their 2014 targets (see Figure 2.1). The largest overachievements in 2014 in absolute terms were made in Italy (41 Mt CO2-eq.), France (36 Mt CO2-eq.) and the United Kingdom (30 Mt CO2-eq.). Of the 18 Member States that achieved 2014 ESD emissions that were less than their 2005 base-year values, eight (Croatia, Cyprus, Greece, Italy, the Netherlands, Portugal, Spain and Sweden) achieved ESD emissions that were over 10 % less than their targets. Despite having a target that was higher than its 2005 base-year levels, Malta’s emissions remained above its 2014 ESD target (by 0.1 million annual emission allocations (AEAs), which is equal to a gap of 11 %).
A similar situation is expected for 2015, based on approximated estimates of ESD emissions: the same Member States as in 2014 are expected to have ESD emissions that are over 10 % below their targets, while Malta is expected to remain the only Member State with ESD emissions exceeding its ESD target for that year (by 0.2 million AEAs; equal to an 18 % gap).
As the differences between Malta’s actual emissions and its targets for 2014 and 2015 are higher than 5 %, a limit up to which it is possible to borrow AEAs from the following year (60 000 AEAs) [1], Malta would need to use additional flexibilities, such as buying AEAs from other Member States, to comply with the ESD.
3.2 Projected progress towards targets under the Effort Sharing Decision
The latest projections reported by Member States show that there are diverse expectations with regard to ESD emission trends for the 2015 to 2020 period. For many Member States, projections are consistent with past trends and suggest continuous decreases in ESD emissions between 2013 and 2020. However, projections do not account for the unusually large decrease that occurred in 2014 (due to particularly warm climatic conditions) and the subsequent rebound (increase in GHG emissions) observed in 2015 (see section 1.1).
The vast majority of Member States projected that their ESD emissions will remain below their annual ESD targets during the whole compliance period (from 2013 to 2020):
- 16 countries projected a decrease in their ESD emissions between 2015 and 2020 (Austria, Belgium, Bulgaria, Cyprus, the Czech Republic, Denmark, Finland, France, Germany, Greece, Hungary, the Netherlands, Portugal, Slovenia, Sweden and the United Kingdom).
- 10 countries projected an increase in their ESD emissions during this period (Croatia, Estonia, Ireland, Italy, Latvia, Lithuania, Poland, Romania, Slovakia and Spain).
- Two countries expect their emissions to decrease first and then increase (Luxembourg and Malta).
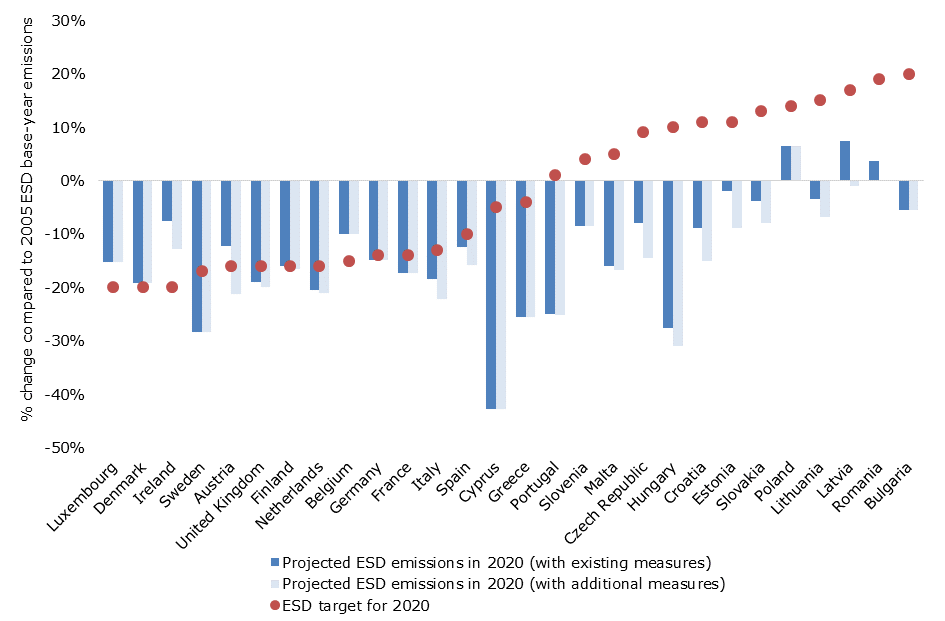
Based on the latest national projections (i.e. those submitted in 2015 or updated in 2016) for the 2016-2020 period, 23 Member States expect that their ESD emissions will stay below their annual targets under the ESD in every year from 2016 to 2020 [2], on the basis of the ‘with existing measures’ (WEM) scenario (see Figure 2.2). These Member States include Finland which, with a projected shortfall of only 0.04 percentage points, which is well within the margin of uncertainty, is considered to be able to reach its 2020 target with current measures in place.
Conversely, for five Member States (Austria, Belgium, Denmark, Ireland and Luxembourg), national projections suggest that emissions could exceed AEAs (i.e. annual ESD targets) for one or several years between 2016 and 2020 (see Table A3.3 in Annex 3). These five Member States all have 2020 targets under the ESD ranging from 15 % to 20 % reductions, compared with 2005 base-year levels. Denmark, Ireland and Luxembourg are the three Member States that have a 20 % reduction target for 2020 under the ESD.
Malta’s projections indicate that the annual ESD targets for the 2016–2020 period will all be achieved, despite the fact that, according to recent data, ESD emissions exceeded annual ESD targets in 2013, 2014 and 2015.
Click on the image for interactive data visualisation
Note: Only 18 Member States submitted a ‘with additional measures’ (WAM) scenario. For the other Member States (Belgium, Bulgaria, Denmark, France, Germany, Greece, Luxembourg, Poland, Slovenia and Sweden), the WEM scenario is shown instead.
Source: EC, 2013a and 2013b; EEA, 2016d.
3.3 Cumulated gaps for 2013-2020 and use of the flexibilities provided under the Effort Sharing Decision
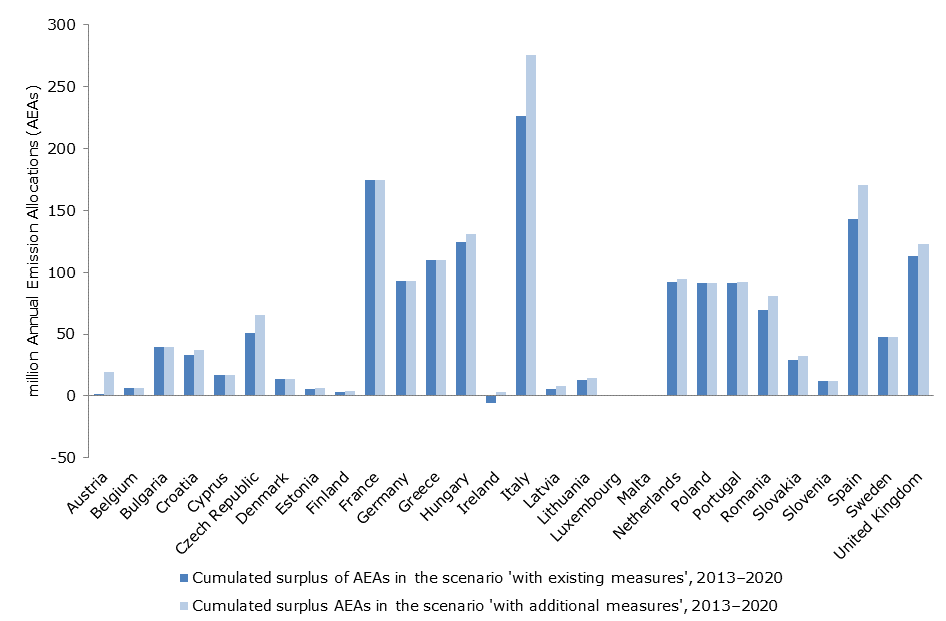
ESD emission targets, expressed in quantities of AEAs, can be considered as annual emission budgets that can be partly transferred from one year to another, as well as between Member States under certain rules defined in the ESD. It is therefore possible to define an overall emission budget under the ESD for the whole 2013–2020 period for each Member State and at EU level. As historic and projected ESD emissions at EU level are below ESD targets, an overall surplus of between 1 600 and 1 760 million AEAs is expected by 2020 at EU level (see section A1.4 in Annex 1).
At Member State level, the size of the expected cumulated AEA surpluses or deficits by 2020 differ greatly (see Figure 2.3). The largest cumulated surpluses are projected for Italy, France and Spain. Only one Member State (Ireland) expects a deficit of AEAs in 2020 if no additional measures are implemented in due time or if no additional flexibilities (other than transfers of surplus AEAs from one year to the following year) are used.
Click on the image for interactive data visualisation
Note: A positive value represents a surplus of AEAs. A negative value represents a shortfall of AEAs.
Only 18 Member States submitted a ‘with additional measures’ (WAM) scenario. For the other Member States (Belgium, Bulgaria, Denmark, France, Germany, Greece, Luxembourg, Poland, Slovenia and Sweden), the WEM scenario is shown instead.
Source: EC, 2013a, 2013b, 2016 and 2017; EEA, 2016a, 2016b, 2016c and 2016d.
Austria, Belgium, Denmark, Ireland and Luxembourg, for which national projections suggest that ESD emissions will exceed ESD targets by 2020, can still meet their obligations under the ESD by enhancing national efforts to reduce their domestic emissions to levels below ESD target levels by 2020, as well as by using flexibility provisions provided for under the ESD (see Table A3.4), as described below:
- For Austria, deficits of AEAs are projected for each year between 2016 and 2020 in the WEM scenario, while the ‘with additional measures’ (WAM) scenario suggests that there will be no deficit. Austria could therefore close its annual gaps by implementing the additional measures currently at planning stage, in particular in the transport sector (e.g. efficiency improvements of vehicles, modal shift to public or non-motorised transport, charging for external effects on noise or air pollution and tolls). Austria could also achieve its ESD targets by using AEAs accumulated between 2013 and 2015. According to the updated projection, this would be sufficient to close the gap in ESD targets by 2020.
- For Belgium, projections indicate that deficits of AEAs could occur between 2017 and 2020 in the WEM scenario, with an estimated gap of 4.0 million AEAs in 2020. No WAM scenario is available and Belgium did not report on additional measures, so no statements can be made with regard to whether or not additional measures could close the estimated gap. Belgium could achieve its ESD targets in the whole period by using surplus AEAs accumulated between 2013 and 2016.
- For Denmark, projections show a small deficit (0.3 million AEAs) for the year 2020 only. Denmark would thus be able to achieve its ESD targets over the whole period by using surplus AEAs accumulated in the years prior to 2020.
- For Ireland, projections show deficits under both scenarios, starting from 2016 (WEM scenario) or 2017 (WAM scenario) until 2020. In the WEM scenario, transferring surplus AEAs accumulated between 2013 and 2015 would not be sufficient for Ireland to comply each year until 2020. Ireland therefore needs to successfully implement additional measures or use other flexibilities. If additional measures are implemented, ESD targets could be reached by using surplus AEAs accumulated between 2013 and 2016. As reported by Ireland, the additional measures that would contribute to closing the gap in ESD sectors include additional energy efficiency measures, a targeted realisation of 40 % of electricity generation from renewables by 2020, the replacement of coal-fired electricity generation by natural gas, retrofits in the industry sector and thermal energy from renewable sources. In the transport sector, additional measures foresee increased deployment of electric vehicles, more efficient traffic movement and 10 % of fuel for road transport from renewables by 2020. Additional measures are also envisaged for the buildings (commercial and residential) sector, in which retrofit schemes, increased use of renewables and building regulations could contribute towards further GHG emission savings. Despite the significant proportion of Ireland’s ESD emissions that are contributed by the agriculture sector, compared with other Member States, only one additional measure is planned for this sector: it is envisaged that nitrification and urease inhibitors will be used in conjunction with nitrogen fertilizers, thereby reducing gaseous losses and reducing total fertilizer nitrogen use.
- For Luxembourg, deficits are projected for the years 2019 and 2020, with a gap of 0.5 million AEAs in 2020. This gap could be filled with the use of surplus AEAs from preceding years. No WAM scenario is available.
Table 4.1 summarises the minimum conditions required to stay within the 2013–2020 ESD budget. Overall, a net surplus of between 1 600 and around 1 760 million AEAs (depending on the scenario considered) could accumulate by 2020 if all unused AEAs are carried over to subsequent years within the compliance period from 2013 to 2020. This surplus is higher than the one calculated in the 2015 assessment (EEA, 2015) (1 500 to 1 700 million AEAs), which results from updated projections submitted in late 2015 and in 2016 by 8 Member States (Austria, Cyprus, Denmark, France, Greece, Hungary, Ireland and Luxembourg). The quantity of surplus AEAs would be largely sufficient to cover the potential deficits observed or expected in a limited number of Member States. So far, no use of flexible mechanisms (transfer of AEAs between Member States or additional flexibility through the purchase of emission credits outside the EU) has been reported.
|
Use of flexibility mechanisms
|
Historic (2013 and 2014)
|
Approximated historic (2015)
|
2016–2020 WEM (a) scenario
|
2016–2020 WAM (a) scenario
|
|
No use of flexibility mechanisms
|
27 Member States (all excepted Malta)
|
27 Member States (all excepted Malta)
|
23 Member States (b)
|
23 Member States plus Austria
|
|
Transfer of AEAs between years only
|
|
|
Austria, Belgium, Denmark, Luxembourg
|
Ireland (c)
|
|
Additional flexibility mechanisms needed
|
Malta
|
Malta
|
Ireland
|
|
(a) The ‘with existing measures scenario’ (WEM) includes adopted measures at the time of preparation of projections. The ‘with additional measures’ (WAM) scenario includes planned measures as well.
(b) The 23 Member States: Bulgaria, Croatia, Cyprus, the Czech Republic, Estonia, Finland, France, Germany, Greece, Hungary, Italy, Latvia, Lithuania, Malta, the Netherlands, Poland, Portugal, Romania, Slovakia, Slovenia, Spain, Sweden and the United Kingdom.
(c) Belgium, Denmark and Luxembourg did not report projections in a WAM scenario.

Document Actions
Share with others