The data and information used in the briefing are available from the European Commission (verified emissions, free allocation and further information on operators under the EU ETS for the years up until 2019) and the EEA (projections of national ETS emissions until 2030 as reported by EU Member States, Iceland, Norway and the United Kingdom). A detailed analysis is available in the report Trends and projections in the EU ETS in 2020, prepared for the EEA by the European Topic Centre on Climate change Mitigation and Energy (ETC/CME, 2020).
The changing fuel mix for power production is driving EU ETS emissions down
The EU ETS covers about 40 % of the EU's total greenhouse gas emissions. It sets a cap on emissions from emission-intensive activities (i.e. electricity and heat production, cement manufacture, iron and steel production, oil refining and other industrial activities) and aviation. Within the cap, companies can reduce their emissions and trade emission allowances, in order to achieve greenhouse gas emission reductions at least cost.
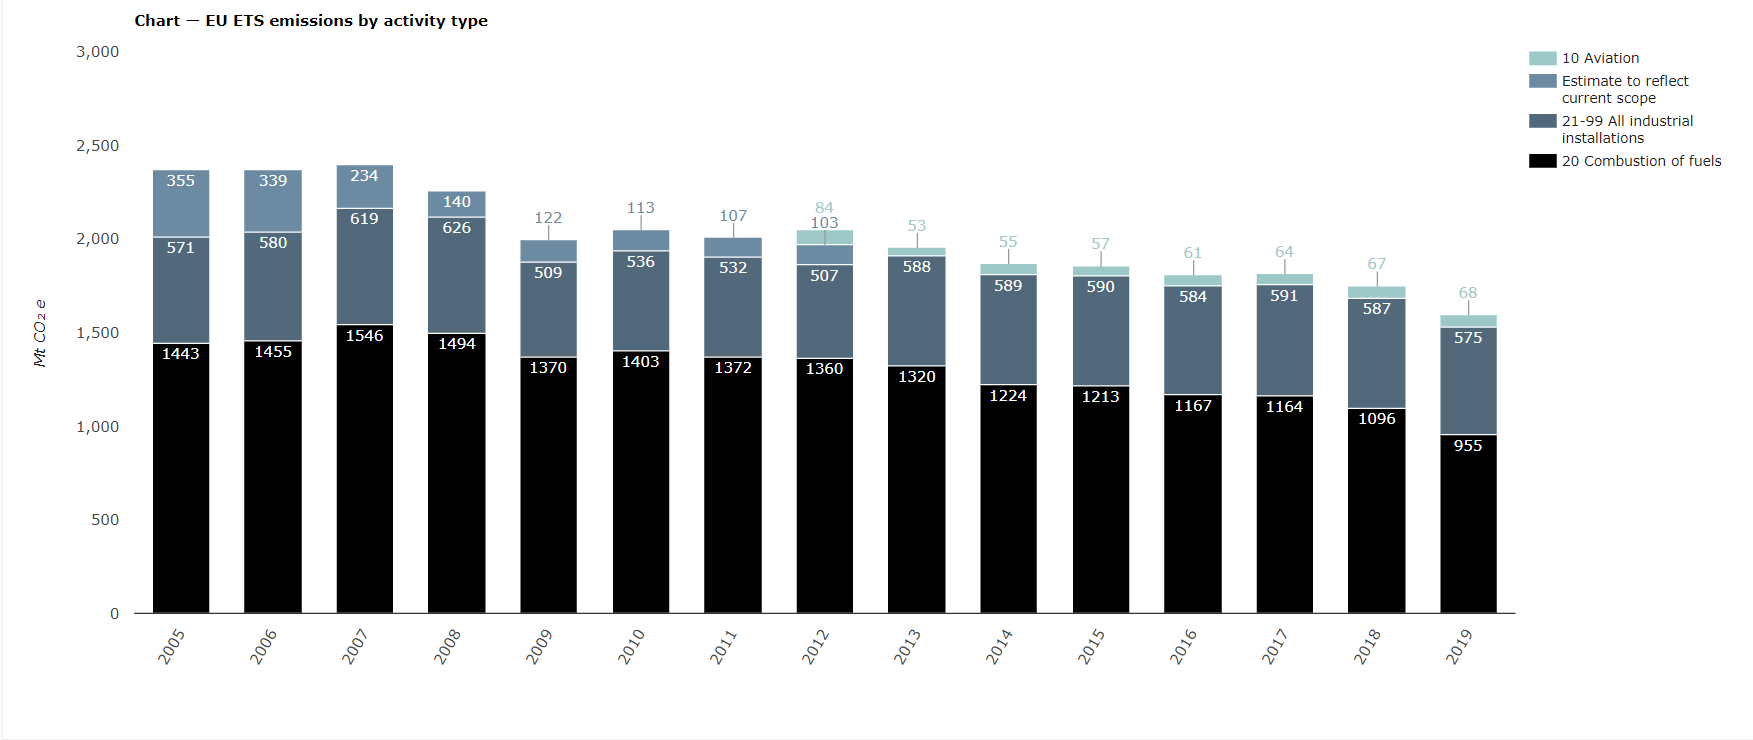
Greenhouse gas emissions from stationary installations in the EU ETS decreased from 1 682 megatonnes of carbon dioxide equivalent (Mt CO2e) in 2018 to 1 530 Mt CO2e in 2019, a reduction of 9.1 %. This represents the largest drop in emissions since 2009. Compared with 2005, emissions had fallen by 35 % in 2019 (Figure 1).
Combustion installations (mainly power stations) are responsible for 60 % of EU ETS emissions ([1]). This activity is the main driver of the decrease observed since the start of the system. Between 2018 and 2019 alone, emissions from combustion installations decreased by 12.9 %, while emissions have decreased by 28 % since the start of the third trading period in 2013.
The reduction in combustion emissions observed between 2018 and 2019 can be explained by a decrease in the amount of electricity produced from coal, following the increase in the price of CO2 and a rising share of renewables in the total energy supply. In many countries, a switch from coal to natural gas can also be observed (Table 1).
Exceptional decreases in emissions from fossil fuel combustion were recorded in several countries, in particular Iceland (-77 %) and Estonia (-47 %). The large decrease in EU ETS emissions for Estonia can be explained by the reduction in electricity produced from oil shale. However, this decrease was mostly offset by electricity imports, which, if coming from third countries, might not be part of the EU ETS and therefore would not appear in EU ETS emission accounts. Three Member States account for over half of the combustion-related emission reductions in 2019: Germany (-54.2 Mt), Poland (-15.6 Mt) and Spain (-15.4 Mt). In Germany and Poland, electricity produced from coal lost ground to natural gas, wind power and imports from neighbouring countries; while in Spain coal was partially displaced by natural gas and, to a lesser extent, increased wind and nuclear generation. Increases in combustion-related emissions were observed in only five Member States (Austria, Belgium, Malta, Luxembourg and Croatia). Belgium and Croatia are the only two countries where there was an increase in the amount of electricity produced from coal.
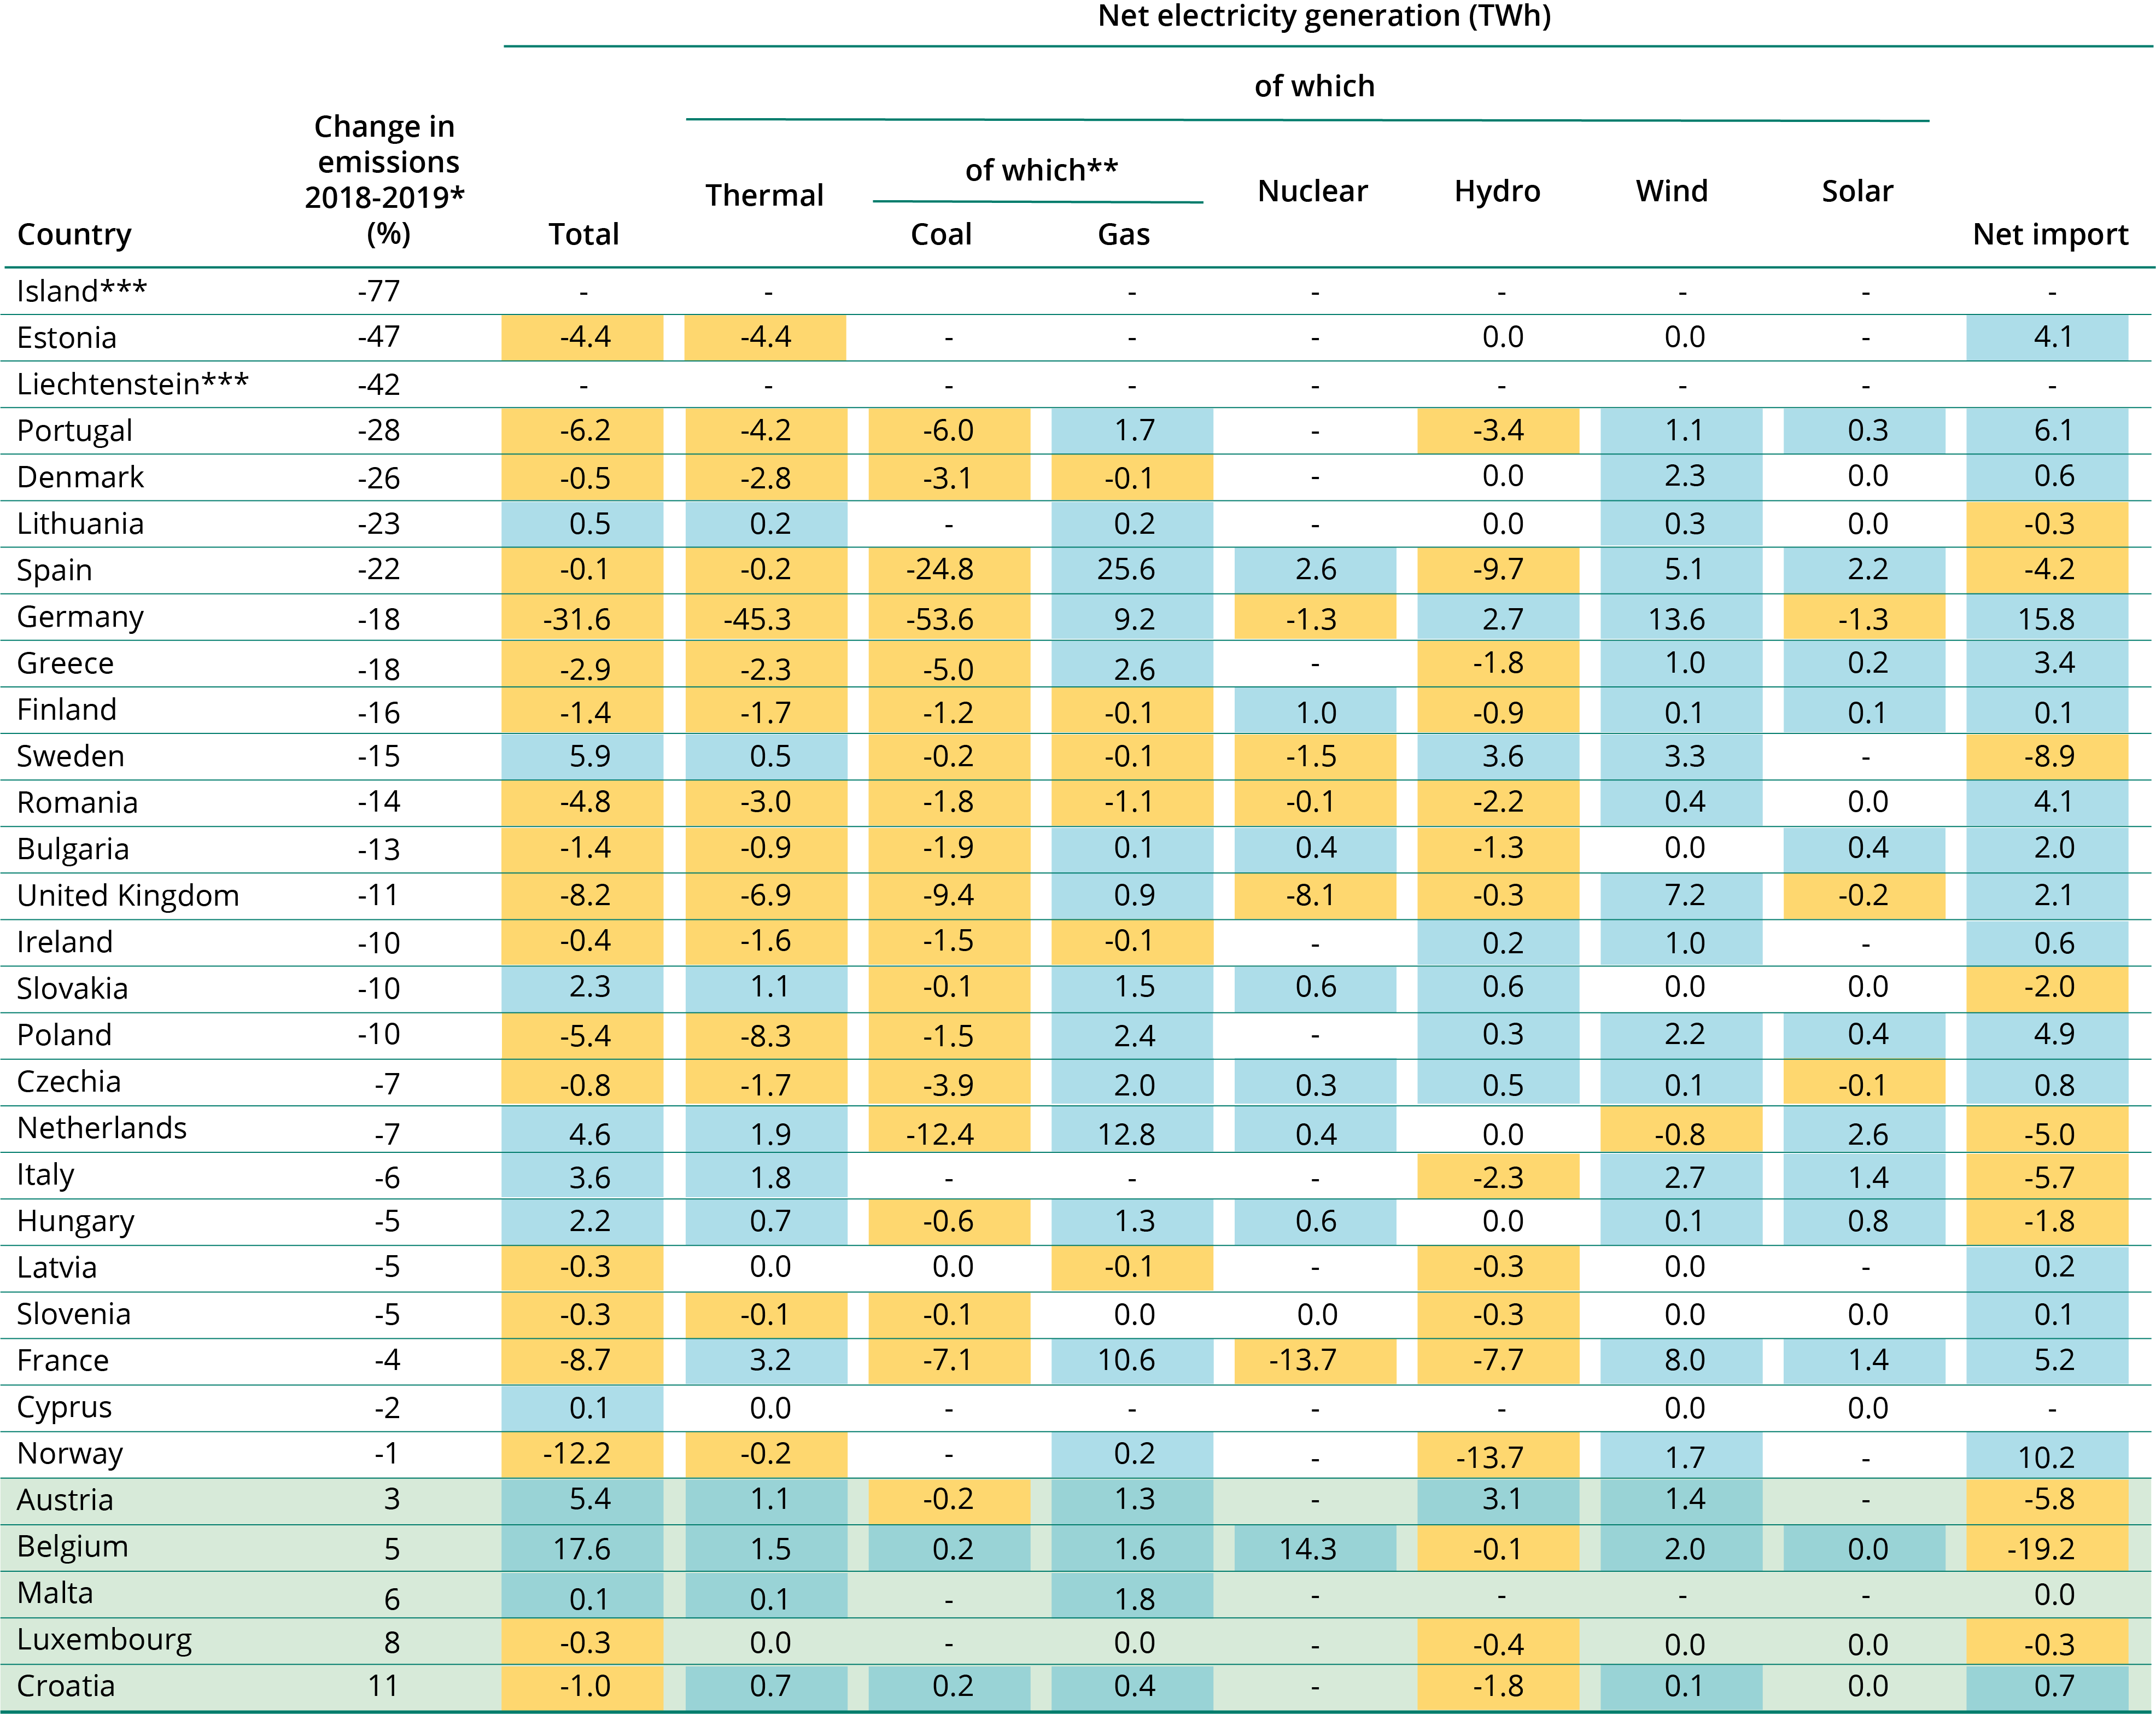
Note:
* Combustion installations (Activity code 20)
** Additional thermal electricity generation is reported by Eurostat from oil, renewable- and non-renewable-sources, which are not shown here.
*** No data on electricity generation available for Iceland and Liechtenstein
Source: Eurostat (2020)
More information
Emissions from ETS installations in other industrial activity codes[2] also fell between 2018 and 2019 (-2.0 %). However, the changes in emissions vary considerably from one activity to another, mainly reflecting different developments in production output, energy efficiency and the use of biomass and waste as an energy source.
In 2019, aviation emissions covered by the EU ETS amounted to 68.2 Mt CO2e. This represents an increase of 1.0 % compared to 2018, following increasing demand for air travel. On the contrary, the supply of EU aviation allowances (EUAA) decreased by 1.8 %. As a result, the total supply of EUAAs (36 million) covered only 53 % of the demand, with operators purchasing the rest on the carbon market.
National projections indicate insufficient reductions to meet 2030 targets
In 2019, EU Member States reported their own greenhouse gas emission projections to the EEA and 13 of them provided updates in 2020. A number of caveats should be added to the analysis of these national emission projections, as they:
- only reflect measures adopted or planned until early 2019 (for most countries);
- do not take into account recent developments, such as the emission decrease observed in 2019, as well as the effects of the measures adopted to fight the Covid-19 pandemic, which are expected to considerably reduce ETS emissions in 2020 and possibly the following years;
- do not yet include the impact of a potential increase in ambition of the EU’s 2030 target.
With these aspects in mind, according to Member States’ projections, ETS emissions are expected to decrease by between 33 % and 40 % by 2030 compared to 2005, depending on the implementation of additional measures reported by some Member States. The current EU target of a reduction of 43 % by 2030 would therefore not be met. However, for the reasons explained above, these should be considered as conservative estimates. For example, a 33 % reduction by 2030 would not even match the 35 % reduction already achieved in 2019. Furthermore, the effect of the Covid-19 pandemic may lead to a situation where ETS emissions in 2020 would be below the projected 40 % reduction, although, the impact of the Covid-19 pandemic on ETS emission levels should, for the most part, be considered as temporary unless backed by structural changes.
Seventeen countries anticipate a decrease in their ETS emissions between 2019 and 2030 (Figure 2), mainly due to growth in the use of renewable energy and the phase-out of carbon-intensive power generation capacity. However, 13 countries project that their ETS emissions will increase, due either to a planned phase-out of nuclear production capacity being replaced by fossil capacity or to an increase in carbon-intensive energy production or other processes.
Another reason for the potential increase in ETS emissions is an anticipated higher level of electricity demand due to electrification in the transport and buildings sector. If this additional demand, which reduces emissions in the Effort Sharing sector, is not backed by similar growth in renewable electricity production, it might lead to increasing ETS emissions.
The picture provided by these national projections might evolve in 2021, when Member States reflect recent policy developments and the Commission proposes to tighten the ETS cap to achieve revised EU emission reduction targets for 2030 and climate neutrality by 2050.
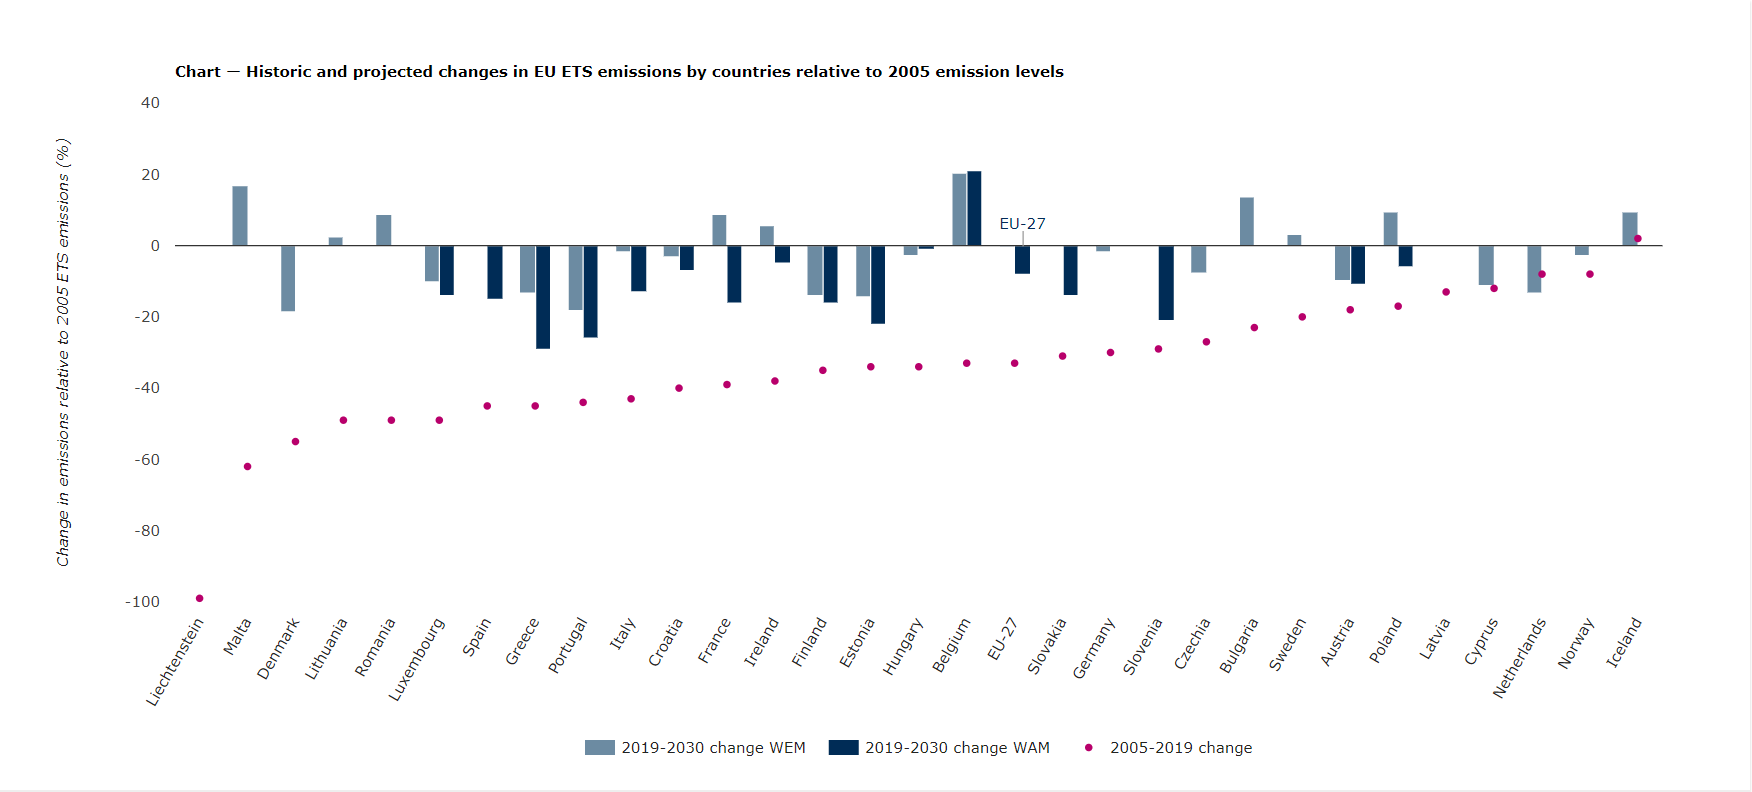
Note: WEM = With Existing Measures scenario; WAM = With Additional Measures scenario
Source: EEA, 2020; projections of EU Member States, Iceland and Norway, compiled by ETC/CME.
More Information
ETS revenues increased despite reduced auctions
Despite Iceland, Liechtenstein and Norway conducting auctions for the first time in the third trading period, the total number of EUAs auctioned in 2019 was 36 % lower than in 2018 (Figure 3). This was because of the Market Stability Reserve (MSR) beginning operations and United Kingdom auction amounts being temporarily withheld as a result of its withdrawal from the EU. Nevertheless, auction revenues increased by EUR 0.45 billion between 2018 and 2019. Allowance prices also continued to rally, rising from an average of EUR 15.5 per tonne in 2018 to EUR 24.7[3] per tonne in 2019, thus overcompensating for the revenue loss from the low auction amounts.
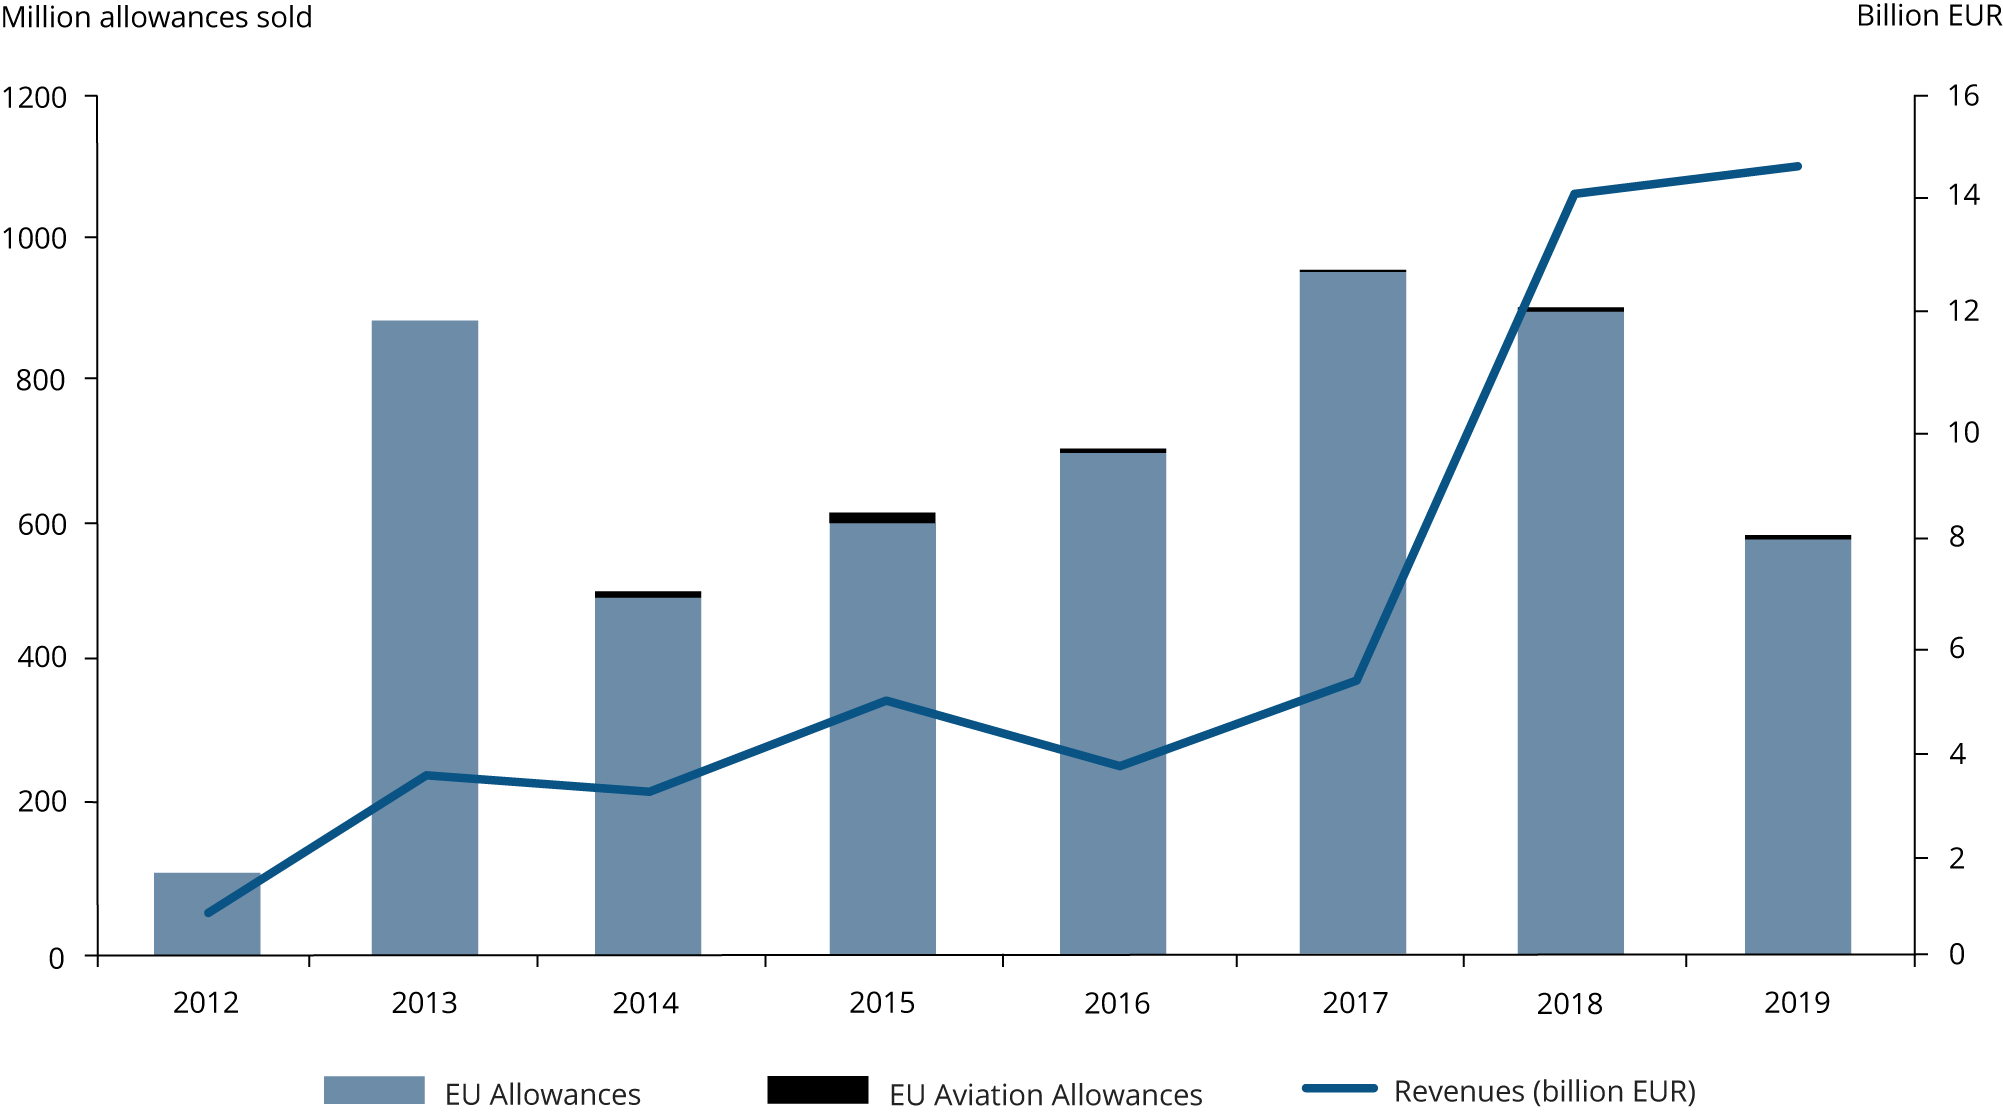
Note: 2012 (early auctions) refer to amounts that pertain to 2013 but had been auctioned a year earlier.
Source: EEX (2020); ICE (2020)
More Information
Footnotes
[1] ‘Combustion installations’ refers to any oxidation of fuels, regardless of the way in which heat, electricity or mechanical energy produced by this process are used, and any other directly associated activities including waste gas scrubbing (EC, 2010). Corresponds to ETS Activity Code 20.
[2] Corresponding to EU ETS Activity codes 21-99.
[3] Primary market auction prices from EEX (2020) and ICE (2020)
References
EC, 2010, Guidance note on interpretation of Annex I of the EU ETS Directive (excl. aviation activities),
EEA, 2020, EU Emissions Trading System (ETS) data viewer,
EEX, 2020, EUA Primary Market Auction Report, European Energy Exchange,
ETC/CME, 2020, Trends and projections in the EU ETS in 2020, European Topic Centre on Climate Change Mitigation and Energy,
Eurostat, 2020, Net electricity generation by type of fuel, monthly data [nrg_cb_pem],
ICE, 2020, Auctions - EUA UK, Market Data, Intercontinental Exchange
Identifiers
Briefing no. 20/2020
Title: The EU Emissions Trading System in 2020: trends and projections
HTML - TH-AM-20-020-EN-Q - ISBN 978-92-9480-300-9 - ISSN 2467-3196 - doi: 10.2800/953150
PDF - TH-AM-20-020-EN-N - ISBN 978-92-9480-301-6 - ISSN 2467-3196 - doi: 10.2800/230740

Document Actions
Share with others