Biodiversity loss degrades natural capital and ecosystem services
‘Biodiversity’ includes all living organisms found in the atmosphere, on land and in water. All species have a role and provide the ‘fabric of life’ on which we depend: from the smallest bacteria in the soil to the largest mammal in the ocean (
1
). The four basic building blocks of biodiversity are genes, species, habitats and ecosystems (
A
). The preservation of biodiversity is fundamental to human well-being and sustainable provisioning of natural resources (
B
). Furthermore it is closely intertwined with other environmental issues, such as the adaptation to climate change or protecting human health.
Europe’s biodiversity is heavily influenced by human activities including agriculture, forestry and fisheries, as well as urbanisation. Roughly half of Europe’s land area is farmed, most forests are exploited, and natural areas are increasingly fragmented by urban areas and infrastructural development. The marine environment is also heavily affected, not just by unsustainable fisheries, but also by other activities such as offshore extraction of oil and gas, sand and gravel extraction, shipping, and offshore wind farms.
Exploitation of natural resources typically leads to disturbance and changes in the diversity of species and habitats. Conversely, extensive agricultural patterns, as seen in Europe’s traditional agricultural landscapes, have contributed to a higher species diversity at a regional level if compared to what could be expected in strictly natural systems. Over-exploitation, however, can lead to degradation of natural ecosystems and ultimately to species extinctions. Examples of such ecological feedbacks are the collapse of commercial fish stocks through overfishing, the decline of pollinators due to intensive agriculture, and reduced water retention and increased flooding risks due to the destruction of moorland.
By introducing the concept of ecosystem services, the Millennium Ecosystem Assessment (
2
) turned the debate on biodiversity loss upside down. Beyond conservationist concerns, biodiversity loss has become an essential part of the debate on human well-being and the sustainability of our lifestyle, including consumption patterns.
Loss of biodiversity can thus lead to degradation of ‘ecosystem services’ and undermine human well-being.
Evidence is growing that ecosystem services are under great pressure globally due to the over-exploitation of natural resources in combination with human-induced climate change (
2
). Ecosystem services are often taken for granted, but are in fact very vulnerable. The soil, for example, is a key component of ecosystems, and supports a rich variety of organisms and provides many regulating and supporting services. Yet it is only, at most, a few meters thick (and often considerably less), and subject to degradation through erosion, pollution, compaction and salinisation (Chapter6).
Although Europe’s population is expected to remain roughly stable over the next decades, the consequences for biodiversity of increasing global resource demand for food, fibres, energy and water, and lifestyle changes are expected to continue to manifest themselves (seeChapter 7). Further land-cover conversion and intensification of land use, both in Europe and in the rest of the world, may negatively affect biodiversity — directly through, for example, habitat destruction and resource depletion, or indirectly through, for example, fragmentation, drainage, eutrophication, acidification and other forms of pollution.
Developments in Europe are likely to affect land-use patterns and biodiversity around the globe — demand for natural resources in Europe already exceeds its own production. The challenge is therefore to reduce Europe’s impact on the global environment while maintaining biodiversity at a level where ecosystem services, the sustainable use of natural resources and human well-being are secured.
Box 3.1 Ecosystem services
Ecosystems provide a number of basic services that are essential for using Earth’s resources sustainably. These include:
-
Provisioning services — the resources that are directly
exploited by humans, such as food, fibres, water, raw materials,
medicines;
- Supporting services — the processes that indirectly allow
exploitation of natural resources, such as primary production,
pollination;
- Regulating services — the natural mechanisms responsible for
climate regulation, nutrient and water circulation, pest regulation,
flood prevention, etc.;
- Cultural services — the benefits people gain from the natural
environment for recreational, cultural and spiritual purposes. In this framework, biodiversity is the basic environmental asset.
Source: Millennium Ecosystem Assessment (
a
).
Europe's ambition is to halt the loss of biodiversity and maintain ecosystem services
The EU is committed to halting the loss of biodiversity by 2010. The main actions have been aimed at selected habitats and species through the Natura2000 network, biodiversity of the wider countryside, the marine environment, invasive alien species, and adaptation to climate change (
3
). The 6th EAP mid-term review in 2006/2007 increased the emphasis on the economic valuation of biodiversity loss, resulting in The Economics of Ecosystems and Biodiversity (TEEB) initiative(
4
) (seeChapter 8).
It has become increasingly clear, however, that despite progress in some areas, the 2010 target will not be met (
5
) (
6
) (
7
) (
8
).
Recognising the urgent need for increased efforts, the European Council endorsed the long-term biodiversity vision for 2050 and a 2020 headline target, adopted by the Environment Council on 15March 2010, of halting the loss of biodiversity and the degradation of ecosystem services in the EU by 2020, and restoring them in so far as feasible, while stepping up the EU contribution to averting global biodiversity loss(
9
). A limited number of measurable sub-targets will be developed using, for example, baseline data for 2010 (
1
).
Key policy instruments are the EU Birds and Habitats Directives(
10
)(
11
), which aim at favourable conservation status for selected species and habitats. Some 750000 terrestrial km2, more than 17% of Europe’s total land area, and more than 160000marine km2 have now been designated under these directives as areas for conservation within the Natura2000 network. Furthermore, an EUstrategy on green infrastructure is in preparation (
12
), building on Natura2000 and flanking sectoral and national initiatives.
The second main strand of policy action is the integration of biodiversity concerns into sectoral policies for transport, energy production, agriculture, forestry and fisheries. This is aimed at reducing the direct impacts from these sectors, as well as their diffuse pressures, such as fragmentation, acidification, eutrophication and pollution.
The Common Agricultural Policy (CAP) is the sectoral framework in the EU with the strongest influence in this respect. The responsibility for forest policy lies primarily with the Member States under the subsidiarity principle. For fisheries, proposals have been made to further integrate environmental aspects into the Common Fisheries Policy. Other major cross-cutting policy frameworks are the Soil Thematic Strategy under the 6th EAP (
13
), the Air Quality Directive(
14
), the National Emissions Ceilings Directive (
15
), the Nitrates Directive(
16
), the Water Framework Directive (
17
) and the Marine Strategy Framework Directive (
18
).
Biodiversity is still in decline
Quantitative data on the status and trends of European biodiversity are sparse, both for conceptual and practical reasons. The spatial scale and level of detail at which ecosystems, habitats and plant communities are discerned is to a certain extent arbitrary. There are no harmonised European monitoring data for ecosystem and habitat quality, and the results of case studies are difficult to combine. Reporting under Article 17 of the Habitats Directive has recently improved the evidence base, but only for the listed habitats (
19
).
Species monitoring is conceptually more straightforward, but resource-intensive and necessarily very selective. Around 1700vertebrate species, 90000 insects and 30000 vascular plants have been recorded in Europe (
20
) (
21
). This figure does not even include the majority of marine species, or bacteria, microbes and soil invertebrates. Harmonised trend data cover only a very small fraction of the total number of species — they are largely limited to common birds and butterflies. Again, Article 17 reporting under the Habitats Directive provides additional material for target species.
The data for common bird species suggest a stabilisation at low levels during the last decade. Populations of forest birds have declined by around 15% since 1990, but from 2000 onwards numbers appear stable. Farmland bird populations declined dramatically in the 1980s, mainly due to agricultural intensification. Their populations have remained stable since the mid-1990s, albeit at a low level. General farming trends (such as lower input use, increased set-aside and share of organic farming) and policy measures (such as targeted agri-environment schemes) may have contributed to this (
22
) (
23
) (
24
). Grassland butterfly populations, however, have declined by a further 50% since 1990, indicating the impact of further intensification of agriculture on the one hand and abandonment on the other.
Figure 3.1 Common birds in Europe — population index
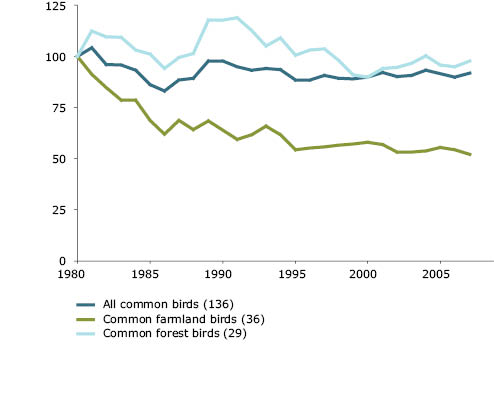
Source: EBCC; RSPB; BirdLife; Statistics Netherlands (
b
); SEBI indicator 01 (
c
).
Link to data
Figure 3.2 Conservation status of species (top) and habitats (bottom) of Community interest in 2008
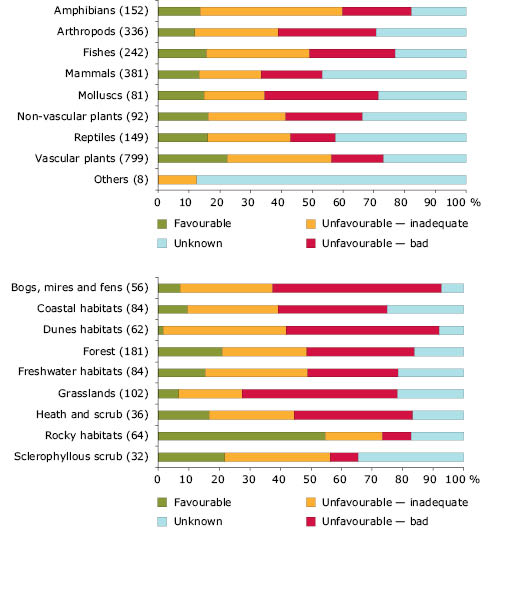
Note: Number of assessments in brackets. Geographical coverage: EU except Bulgaria and Romania.
Source: EEA, ETC Biological Diversity (
d
); SEBI indicator03(
e
). Link to data: top, bottom.
The conservation status of the most threatened species and habitats remains worrying despite the now established Natura2000 network of protected areas. The situation appears worst for aquatic habitats, coastal zones and nutrient-poor terrestrial habitats, such as heaths, bogs, mires and fens. In 2008, only 17% of the target species under the Habitats Directive were considered to have a favourable conservation status, 52% an unfavourable status, and the status of 31% was unknown.
These aggregated data, however, do not allow conclusions about the effectiveness of the protection regime of the Habitats Directive, since time series are not yet available and habitat restoration and species recovery may require more time. Also, no comparison can currently be made between protected and unprotected areas within the species’ ranges. For the Birds Directive, however, studies indicate that the bird conservation measures in Natura 2000 have been effective (
25
).
The cumulative number of alien species in Europe has been increasing steadily since the beginning of the 20th century. Out of a total of 10000 established alien species, 163 have been classified as the worst invasives because they have proved to be highly invasive and damaging to native biodiversity in at least part of their European range (
7
). While the increase may be slowing down or levelling off for terrestrial and freshwater species, this is not the case for marine and estuarine species.
Land conversion drives biodiversity loss and degradation of soil functions
The main land-cover types in Europe are forest, 35%; arable, 25%; pasture, 17%; semi-natural vegetation, 8%; water bodies, 3%; wetlands, 2%; and artificial — built up — areas, 4% (
C
). The trend of land-cover changes between 2000 and 2006 is rather similar to that observed between 1990 and 2000; however, the annual rate of change was lower — 0.2% in the period 1990 to 2000 compared with 0.1% in the period 2000 to 2006 (
26
).
Figure 3.3 Net land-cover changes 2000–2006 in Europe — total area change in hectares and percentage change

Note: Data coverage is for all 32 EEA member countries — with the exception of Greece and the United Kingdom — and 6 EEA cooperating countries.
Source: EEA, ETC Land Use and Spatial Information (
f
). Link to data
Overall, urban areas have expanded further at the expense of all other land-cover categories, with the exception of forests and water bodies. Urbanisation and expanding transport networks are fragmenting habitats, thus making populations of animals and plants more vulnerable to local extinction due to hampered migration and dispersal.
These land-cover changes affect ecosystem services. Soil characteristics play a crucial role here because they influence water, nutrient and carbon cycles. Soil organic matter is a major terrestrial sink of carbon and thus important for mitigating climate change. Peat soils represent the highest concentration of organic matter in all soils, followed by extensively managed grassland and forest: soil carbon losses thus occur when these systems are converted. Loss of these habitats is also associated with decreased water retention capacity, increased flooding and erosion risks and reduced attractiveness for outdoor recreation.
While the slight forest increase is a positive development, the decline of natural and semi-natural habitats — including grassland, bogs, heaths and fens; all with a high content of soil organic matter — is a major cause for concern.
Forests are heavily exploited: the share of old-growth stands is critically low
Forests are crucial for biodiversity and ecosystem service delivery. They provide natural habitats for plant and animal life, protection against soil erosion and flooding, carbon sequestration, climate regulation and have great recreational and cultural value. Forest is the predominant natural vegetation in Europe, but the remaining forests in Europe are far from undisturbed (
D
). Most are heavily exploited. Exploited forests typically lack higher amounts of deadwood and older trees as habitats for species, and they often show a high portion of non-native tree species (for example, Douglas fir). A share of 10% of old-growth forest has been suggested as a minimum for maintaining viable populations of the most critical forest species (
27
).
Only 5% of the European forest area is currently considered to be undisturbed by humans (
D
). The largest areas of old-growth forests in the EU are found in Bulgaria and Romania (
28
). Loss of old-growth forest, in combination with increased fragmentation of the remaining stands, partially explains the continuing poor conservation status of many forest species of European concern. Since actual species extinction may occur long after the habitat fragmentation that causes it, we face an ‘ecological debt’ — some 1000 old-growth boreal forest species have been identified as being at serious risk of extinction in the long term (
29
).
Figure 3.4 Intensity of forestry — net annual increment in growing stock and annual fellings of forest available for wood supply — 32 EEA member countries, 1990–2005
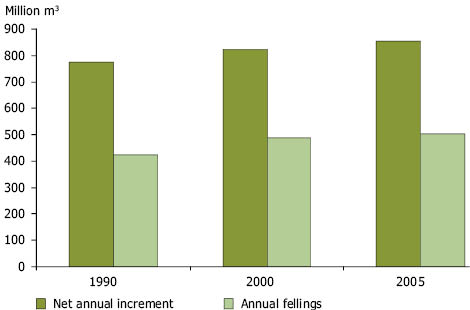
Source: EEA. Link to data
On the plus side, current total wood harvest remains well below the annual re-growth and total forest area increases. This is supported by socio-economic trends and national policy initiatives to improve forest management, coordinated in the framework of Forest Europe, a cooperation platform at ministerial level of 46 countries, including those of the EU (
30
).
Forest management is not only aimed at safeguarding wood harvest, but takes a wide range of forest functions into account, and thus serves as a framework for biodiversity conservation and the maintenance of ecosystem services in forests. Nevertheless, many issues remain to be addressed. A recent EU Green Paper (
31
) focuses on the possible implications of climate change for forest management and protection in Europe and on enhancing monitoring, reporting and knowledge-sharing. There are also concerns regarding the future balance between wood supply and demand in the EU-27 given the planned increases in bioenergy production (
32
).
Map 3.1 Intensity of forestry — net harvesting rate in 2005
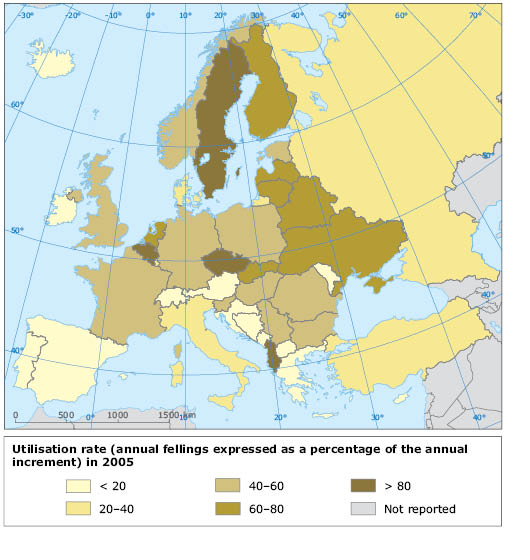
Source: EEA; Forest Europe (
g
). Link to data
Farmland areas decrease but management intensifies: species-rich grasslands are in decline
The concept of ecosystem services is probably most obvious for agriculture. The prime objective is food provision, but farmland delivers many other ecosystem services. Europe’s traditional agricultural landscapes are a major cultural heritage, attract tourism and offer outdoor recreation opportunities. Farmland soils play a key role in nutrient and water cycling.
European agriculture is characterised by a dual trend: large-scale intensification in some regions, and land abandonment in others. Intensification is aimed at yield increases and requires investment in machinery, drainage, fertilisers and pesticides. It is also often associated with simplified crop rotations. Where socio-economic and biophysical circumstances do not allow this, agriculture remains extensive or is given up. These developments have been driven by a combination of factors including technological innovation, policy support and international market developments, as well as climate change, demographic trends and lifestyle changes. The concentration and optimisation of agricultural production has had major consequences for biodiversity, as has become apparent in the decline of farmland birds and butterflies.
Agricultural areas with high biodiversity, such as extensive grasslands, still make up about 30% of Europe’s farmland. Although its natural and cultural value is recognised in European environment and agriculture policies, the current measures being taken within the framework of the CAP are not sufficient to prevent further decline. The vast majority of High Nature Value (HNV) farmland, about 80%, is outside protected areas (
E
)(
33
). The remaining 20% is protected under the Birds and Habitats Directives. Sixty-one of the 231 habitat types of Community interest of the EU Habitats Directive are related to agricultural management, mainly grazing and mowing (
34
).
The assessment reports provided by EU member states under the Habitats Directive (
35
) indicate that the conservation status of these agricultural habitats is worse than the others. Potentially favourable measures under the rural development regulation — the second pillar of the CAP — make up less than 10% of total CAP expenditure and appear weakly targeted at HNV farmland conservation. The vast majority of CAP support still benefits the most intensive productive areas and farming systems (
36
). Decoupling subsidies from production(
F
) and obligatory cross-compliance with environmental legislation can ease agricultural pressures on the environment to some extent, but this is not enough to ensure the continuing management that is needed for effective HNV farmland conservation.
Intensification of agriculture poses threats not only to biodiversity on farmland, but also to biodiversity in farmland soil. The total weight of microorganisms in the soil below a hectare of temperate grassland can exceed 5 tonnes — as much as a medium-sized elephant — and often exceeds the above-ground biomass. These biota are involved in most of the key soil functions. Soil conservation is therefore a major environmental concern as soil degradation processes are widespread in the EU (Chapter6).
Increasing bioenergy production — for example, in the context of the EU target of increasing the share of renewable energy used in transport to 10% by 2020 (
37
) — has also increased pressures on agricultural land resources and biodiversity. The conversion of land to certain types of biofuel crop production leads to intensification in terms of fertiliser and pesticide use, increased pollution load and further biodiversity loss. Much depends on where the conversion takes place, and the extent to which European production contributes to reaching the biofuel target. The available information suggests that the trend towards concentration of agriculture in the most productive areas, as well as to further intensity and productivity increases, is likely to continue (
38
).
Map 3.2 Approximate distribution of HNV farmland in EU-27 (
E
)
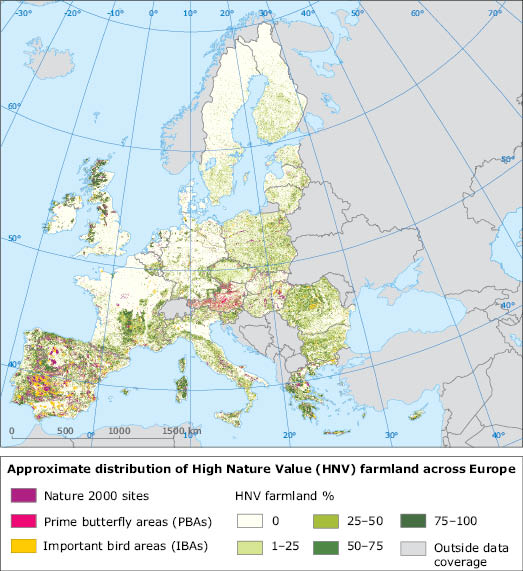
Note: Estimate based on land-cover data (Corine, 2000) and additional biodiversity datasets with varying base years (roughly 2000–2006). Resolution: 1 km2 for the land-cover data, down to 0.5 ha for additional data-layers. The figures in the map (green shades) correspond to estimated coverage of HNV farmland within 1 km2 grid-cells. Because of the error margins in the interpretation of the land-cover data, these figures are best treated as probabilities of occurrence rather than land-cover estimates. Occurrence of HNV farmland in the pink, purple and orange areas is most certain, since these delineations are based on actual habitat and species data.
Source: JRC, EEA (
h
); SEBI indicator 20 (
i
). Link to data
Terrestrial and freshwater ecosystems are still under pressure despite reduced pollution loads
Apart from the direct effects of land conversion and exploitation, human activities such as agriculture, industry, waste production and transport cause indirect and cumulative effects on biodiversity — notably through air, soil and water pollution. A wide range of pollutants — including excess nutrients, pesticides, microbes, industrial chemicals, metals and pharmaceutical products — end up in the soil, or in ground- and surface water. Atmospheric deposition of eutrophying and acidifying substances, including nitrogen oxide (NOX), ammonium plus ammonia (NHX) and sulphur dioxide (SO2), adds to the cocktail of pollutants. The effects on ecosystems include damage to forests and lakes from acidification; habitat deterioration due to nutrient enrichment; algal blooms caused by nutrient enrichment; and neural and endocrine disruption in species by pesticides, steroidal estrogens and industrial chemicals like PCBs.
Most European data regarding the effects of pollutants on biodiversity and ecosystems concern acidification and eutrophication (
G
). One of the success stories of Europe’s environment policy has been the significant reduction in emissions of the acidifying pollutant SO2 since the 1970s. The area subject to acidification has decreased further since 1990. In 2010, 10% of the EEA-32 natural ecosystem area is, however, still subject to acid depositions beyond its critical load. With sulphur emissions declining, nitrogen emitted by agriculture is now the principal acidifying component in our air (
39
).
Agriculture is also a major source of eutrophication through emissions of excess nitrogen and phosphorous, both used as nutrients. The agricultural nutrient balance for many EU Member States has improved in recent years, but more than 40% of sensitive terrestrial and freshwater ecosystem areas are still subject to atmospheric nitrogen deposition beyond their critical loads. Agricultural nitrogen loads are expected to remain high as nitrogen fertiliser use in the EU is projected to increase by around 4% by 2020 (
40
).
Phosphorous in freshwater systems stems mainly from run-off from agriculture and discharges from municipal wastewater treatment plants. There has been a significant decline of phosphate concentrations in rivers and lakes, mainly due to progressive implementation of the Urban Wastewater Treatment Directive (
41
) since the early 1990s. Current concentrations, however, often exceed the minimum level for eutrophication. In some water bodies they are such that substantial improvements will be required to achieve good status under the Water Framework Directive (WFD).
Paramount to attainment of good status by 2015 under the WFD(
17
) will be a reduction in the excessive nutrient levels found in a number of water bodies across Europe, as well as the restoration of connectivity and hydro-morphological conditions. River basin management plans set up by Member States under the WFD, due to be operational by 2012, will have to incorporate a suite of cost-effective measures to tackle all sources of nutrient pollution. This will also need particular policy efforts regarding the further integration of environmental aspects into the CAP. Furthermore, full implementation of the Nitrates Directive and compliance with the Birds and Habitats Directives are key flanking policy actions in support of the WFD.
Map 3.3 Exceedances of critical loads for eutrophication due to the deposition of nutrient nitrogen in 2000
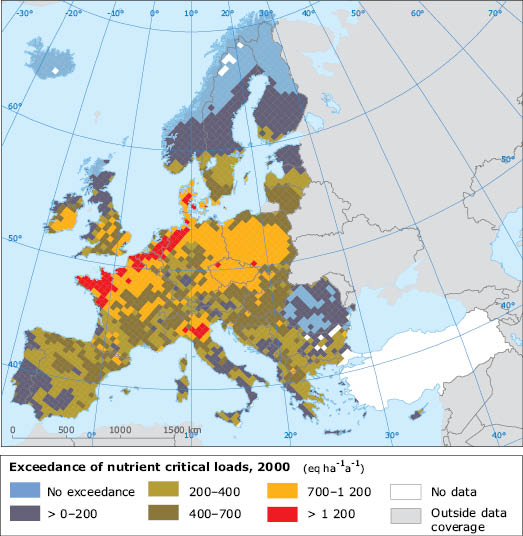
Note: The results were computed using the 2008 Critical Loads database hosted by the Coordination Centre for Effects (CCE) and Clean Air for Europe scenarios (
j
) (
k
). Turkey has not been included in the analyses due to an insufficient data basis for calculating critical loads. For Malta no data were available.
Source: SEBI indicator 09 (
l
). Link to data
Map 3.4 Exceedances of critical loads for eutrophication due to the deposition of nutrient nitrogen in 2010
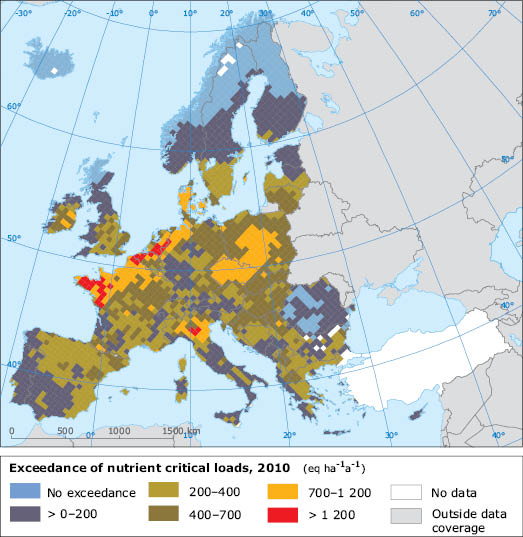
Note: The results were computed using the 2008 Critical Loads database hosted by the Coordination Centre for Effects (CCE) and Clean Air for Europe scenarios (
j
) (
k
). Turkey has not been included in the analyses due to an insufficient data basis for calculating critical loads. For Malta no data were available.
Source: SEBI indicator 09 (
l
). Link to data
The marine environment is heavily affected by pollution and overfishing
Much of the freshwater pollutant load, described in the previous section, is ultimately discharged to coastal waters, making agriculture also the main source of nitrogen loads in the marine environment. Atmospheric deposition of nitrogen — ammonia (NH3) originating from agriculture, and NOX from ship emissions — is increasing and can be 30% or more of the total nitrogen load to the sea surface.
Nutrient enrichment is a major problem in the marine environment, where it accelerates the growth of phytoplankton. It can change the composition and abundance of marine organisms living in the affected waters and ultimately leads to oxygen depletion, thus killing bottom-dwelling organisms. Oxygen depletion has escalated dramatically over the past 50 years, increasing from about ten documented cases in 1960 to at least 169 in 2007 worldwide (
42
); and it is expected to become more widespread with increasing sea temperatures induced by climate change. In Europe, the problem is particularly evident in the Baltic Sea, where the current ecological status is regarded as predominantly poor to bad (
43
).
The marine environment is also heavily impacted by fisheries. Fish provide the primary source of income for many coastal communities, but overfishing is threatening the viability of both European and global fish stocks (
44
). Of the assessed commercial stocks in the Baltic Sea, 21% are outside safe biological limits (
H
). For the areas of the North-East Atlantic, the percentages of stocks outside safe biological limits vary between 25% in the Arctic East and 62% in the Bay of Biscay. In the Mediterranean Sea, the percentage of stocks outside safe biological limits is about 60%, with four out of six areas exceeding 60% (
45
).
Overfishing not only reduces the total stock of commercial species, but affects the age and size distribution within fish populations, as well as the species composition of the marine ecosystem. The average size of the fish caught has decreased, and there has also been a serious decrease in the numbers of large predatory fish species, which occupy the higher trophic levels (
46
). The consequences of this for the marine ecosystem are still poorly understood, but could be substantial.
While the Common Fisheries Policy (CFP) reform in 2002 stated conservation objectives, it is widely acknowledged that these have not been achieved. An EU Green Paper on reforming the CFP in 2009 called for a complete reform of the way fisheries are managed (
47
). It acknowledges over-fishing, fleet over-capacity, heavy subsidies, low economic resilience and a decline in the biomass of fish caught by European fishermen. This marks an important step towards implementation of an ecosystem-based approach that regulates human exploitation of marine resources from the much wider perspective of ecosystem services.
Map 3.5 Proportion of fish stocks within and outside safe biological limits
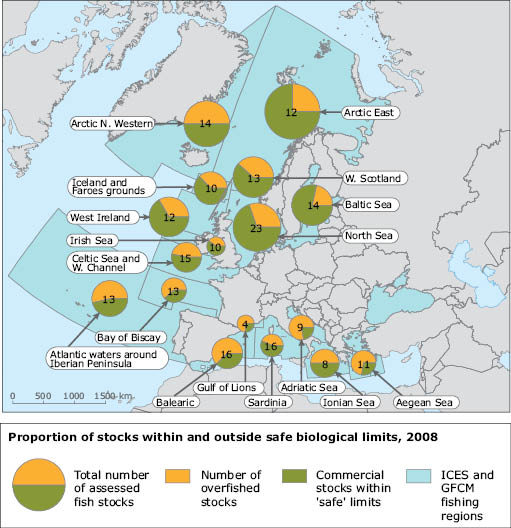
Source: GFCM (
m
); ICES (
n
); SEBI indicator 21 (
o
)
Maintaining biodiversity, also at global level, is crucial for people
Biodiversity loss has ultimately far-reaching consequences for people through impacts on ecosystem services. Large-scale cultivation and drainage of natural systems has increased carbon emissions to the air and at the same time reduced carbon and water retention capacity. Increased run-off speed, combined with increased precipitation as a result of climate change, is a dangerous cocktail that more and more people have come to experience in the shape of serious flooding.
Biodiversity affects well-being also through providing recreational opportunities and appealing landscapes, a relationship that is increasingly recognised in urban design and spatial planning. Less obvious perhaps, but equally important, is the relationship between the distribution patterns of species and habitats and vector-borne diseases. Invasive alien species may pose a threat in this respect. Their dispersal capacity and potential to become invasive, is enhanced by the globalisation of trade, combined with climate change and the increased vulnerability of agricultural monocultures.
Globalisation also leads to spatially displaced impacts of the use of natural resources. The depletion of European fish stocks, for example, has not resulted in domestic food shortages, but has been compensated by an increasing reliance on imports. Whereas the EU was largely self-sufficient until 1997 (when total catch had grown to 8million tonnes), domestic supply levels had fallen to over 50% in 2007 (5.5 million tonnes of 9.5 million tonnes consumed) (
48
).
Large net imports also occur for cereals (around 7.5 million tonnes), fodder (around 26 million tonnes) and wood (around 20 million tonnes) (
49
), again with implications for biodiversity outside Europe (such as deforestation in the tropics). Furthermore, the rapidly growing demand for biofuels may further increase Europe’s global footprint (Chapter6). Trends such as these increase pressure on global resources (Chapter7).
Overall, the many contributions of biodiversity to human well-being are becoming more explicit. Increasingly we associate the food we eat, our clothes and building materials with ‘biodiversity’. It is a vital resource that needs to be managed sustainably and provided with protection, so that in turn it protects us and the planet. At the same time, Europe is currently consuming twice what its land and seas can produce.
Reconciling these realities lies at the core of the proposed EU 2050 vision and 2020 headline target; achieving progress requires the active involvement of all citizens — not just those economic sectors and actors highlighted throughout this assessment.

Document Actions
Share with others