next
previous
items

Briefing

Increasing environmental pollution (GMT 10)

Briefing Published 18 Feb 2015 Last modified 11 May 2020
13 min read
Photo: © Jonathan Díaz Marbá / EEA

Globally, levels of air pollution and releases of nutrients from agriculture and wastewater remain high, causing acidification and eutrophication in ecosystems, and losses in agricultural yield. In the coming decades, overall pollution levels are projected to increase strongly, particularly in Asia.

Although Europe’s pollutant releases are expected to continue declining, European ecosystems and citizens are likely to be affected by developments in other regions. For example, despite a fall in air pollutant emissions there has not been an equivalent improvement in air quality across Europe, partly as a result of the transboundary transport of air pollutants.

Key drivers

Since the start of the industrial revolution in the 19th century environmental pollution has grown into a global transboundary problem that affects air, water, soil and ecosystems, and is linked directly to human health and well-being (GMT 3). A key driver is the growth of the global population, from an estimated 1 billion in at the beginning of the 19th century to more than 7 billion today (GMT 1). This, combined with rapid, albeit uneven, economic development, has led to a massive increase in global production, consumption and mobility, together with increased demand for food and energy.

Pollution is linked to three main human activities: fossil-fuel combustion, primarily by industry and transport; the application of synthetic fertilisers and pesticides in agriculture; and the growing use and complexity of chemicals.

From 1990 to 2010, annual global emissions from fossil fuels rose by 50 %, from around 6 billion tonnes to almost 9 billion tonnes.[1] Fertiliser application per agricultural unit varies, but is particularly intense in China and increasing strongly in India. In contrast, it is declining slightly in Europe, though it remains above the global average.[2] In terms of chemicals, more than 100 000 substances are commercially available in Europe alone, and the number of new substances coming on to the global market is increasing rapidly.[3]

Trends

Air pollution[4]

Four main substances are cause for concern: nitrogen[5], sulphur, ozone[6] and particulate matter.

Atmospheric nitrogen pollution primarily consists of emissions of nitrogen oxides from industry and transport, and emissions of ammonia from agriculture.[1] Global emissions of nitrogen oxides increased rapidly until around 1990, then fell significantly in Europe[7] but continued to grow in Asia. According to the representative concentration pathways (RCP) projections[8], emissions of nitrogen oxides are projected to continue to decrease in Europe up to 2050. In Asia, decreases may only start after another two or three decades of increase. Global ammonia emissions have followed a similar trajectory, but unlike nitrogen oxides, further increases are projected in most regions, with the possible exception of Europe.[9]

The formation of ozone is mainly driven by anthropogenic emissions of ozone precursors, such as methane and nitrogen oxides. Global modelling suggests that annual mean ozone concentrations in Europe increased until about 1990. Concentrations in East and South Asia have continuously risen since the 1950s and are projected to increase further or remain at high levels in the coming decades (Figure 1) depending on assumptions regarding global and regional emission pathways, as well as changes in the climate system.[1]

Intercontinental transport of particulate matter and ozone is a growing concern.[9] Measurements in Europe and North America show that trans-oceanic air flows can lead to ozone concentrations that exceed air quality standards. Increasing emissions of methane and other precursors in other parts of the world might offset European emission-mitigation measures[9] – despite substantial reductions of ozone-precursor gases in 2002–2011, measured ozone concentrations in Europe have only decreased marginally. Similarly, reductions in particulate emissions in Europe have not led to proportional reductions in their concentrations.[10] These trends are at least partial evidence of the intercontinental transport of particulate matter and ozone-precursors.

Figure 1: Historical and projected trends in ozone concentrations for Europe, North America, East and South Asia, 1950–2050[11]
 

Source: Wild et al. (2012)
Note: The graphs shows the results from a study that estimates regionally averaged changes in surface ozone due to past or future changes in anthropogenic precursor emissions based on 14 global chemistry transport models. Changes refer to ground-level ozone concentrations in 2000, expressed as parts per billion by volume (ppbv).

Releases of pollutants to aquatic systems and soils

In addition to deposits from the air, pollution of water, including groundwater, and soil results from diffuse agricultural or urban/industrial sources. One example is reactive nitrogen pollution of coastal ecosystems from agricultural fertiliser run-off into streams and rivers.[12] At a global scale, increasing nitrogen and phosphorus pollution has become a major problem, as current levels may already exceed globally sustainable limits.[13]

Nutrient effluents from agriculture occur if synthetic fertiliser is applied inefficiently – in excess, at the wrong time, etc. Global fertiliser use is projected to increase markedly during the 21st century, from around 90 million tonnes in 2000[14] to potentially more than 150 million tonnes in 2050.[15] Projections based on the RCP scenarios suggest that intensified biofuel production could also lead to high nitrogen fertiliser consumption (Figure 2).[14] Thus, there could be trade-offs between greenhouse gas mitigation and pollution abatement.

Moreover, effluents from wastewater are projected to increase across the world, partly due to rapid urbanisation and the cost of adequate wastewater treatment systems. Globally, nitrogen and phosphorus effluents may increase by 180 % and 150 % respectively between 2000 and 2050, with, for example, the amount of phosphorus discharged annually into the Pacific Ocean possibly almost doubling between 2000 and 2050.[16]

Figure 2: Historical trend in global agricultural demand for industrial nitrogen fertiliser, 1910–2008; projections to 2100 based on RCP scenarios; and drivers of the projected changes in demand in 2100[14]
 

Source: Winiwarter et al. (2013)
Note: Projections are based on the concepts of the RCPs.[17]

Diet optimisation refers to a shift in consumption towards foods produced with more effective nitrogen uptake. Efficiency increase refers to the ratio of nutrients taken up by crops to the total amount of nutrients applied to soil.

Implications

Biodiversity and ecosystem services

The acidification of freshwater ecosystems and soil in terrestrial ecosystems due to the deposition of airborne sulphur and nitrogen compounds poses a serious threat to global plant diversity[18] and the capacity of ecosystems to provide services (GMT 8). In such conditions, species well adapted to acidic environments are likely to thrive, displacing other plants and reducing diversity.[19] An annual deposition of 5–10 kg of nitrogen per hectare has been estimated as a general threshold value for adverse effects on biodiversity.[20] Acidic depositions in Europe have declined significantly since the 1980s.[21] However, Asian and African ecosystems may face increased risk of acidification in the coming 50 years, depending on the interplay of soil properties, individual site-management and regional and international policies. Areas at particular risk are South, Southeast and East Asia, where little of the emitted substances are neutralised by atmospheric alkaline desert dust.[22] At a global scale, 40 % of protected areas currently designated under the Convention on Biological Diversity received annual nitrogen depositions exceeding the threshold of 10 kg per hectare in 2000.[23]

Ozone makes it harder for plants to photosynthesise, so high levels of ozone may also have significant effects on biodiversity and crops.[24] This might, for example, take the form of changes in the species composition of semi-natural vegetation communities[25] or reductions in tree productivity.[26] Some locations at high risk of ozone effects also face substantial risks from nitrogen deposition.[20] Examples include the forests of Southeast Asia and southwest China.

The eutrophication of aquatic ecosystems is caused by high nutrient concentrations, in particular phosphates and nitrates. These have been linked to serious losses of aquatic life[27] and may cause hypoxia – aquatic ecosystems lacking sufficient oxygen to support most forms of life, producing dead zones.[28] In the three years between 2008 and 2011 the number of eutrophication cases in marine ecosystems reported globally increased from around 400 to more than 750.[29] Dead zones are particularly common along the coasts of North America, East Asia and Europe.[30] Indeed, the Baltic Sea has been characterised as the largest human-induced hypoxic area globally, with a ten-fold increase in hypoxia over the last 115 years, mainly due to effluents from agriculture.[31]

Similarly, eutrophication of freshwater ecosystems – rivers and lakes – also remains a key challenge.[1] Assuming that existing legislative frameworks remain unchanged, estimates suggest that the number of lakes with hypoxia may increase globally by 20 % by 2050.[16]

Agriculture and food provision

Global agricultural production is affected by high concentrations of ozone, as well as by other threats including climate change (GMT 9). In rural areas, elevated ozone levels tend to last longer and potentially cause a wide variety of damage to various ecosystems, notably decreasing crop yields.

Global estimates suggest that the range of current relative yield losses (RYL) are 7–12 % for wheat, 6–16 % for soybeans, 3–4 % for rice, and 3–5 % for maize.[32] Highly productive agricultural areas, such as parts of Europe, India, and the mid-west United States, are particularly affected by substantial production losses due to ozone. Assuming that current legislation remains unchanged, yield losses are projected to increase, especially in Asia, and particularly of soybeans and maize. In Europe and North America yield loss is projected to fall (Figure 3).[33]

Figure 3: Projected differences in relative yield losses for wheat,rice, maize and soy beans due to high ozone concentrations, major world regions, 2005–2030[33]

Source: UNEP and WHO (2011)
Note: the 2030 scenario assumes the implementation of current legislation for the major world regions. Positive relative yield loss values signify increased yield losses in 2030 compared with 2005.


References and footnotes

[1] UNEP (2012a), 'Global Environment Outlook 5 — Environment for the future we want', United Nations Environment Programme, Nairobi, Kenya.

[2] FAO (2013), FAOSTAT, Food and Agriculture Organization of the United Nations, Rome, Italy, accessed 5 November 2013.

[3] Of particular concern are persistent, bio-accumulative and toxic substances that remain in the environment for a long time.[34] However, due to space limitations chemicals are not further assessed here.

[4] For details of air pollution, agriculture and water see the SOER 2015 European briefings.

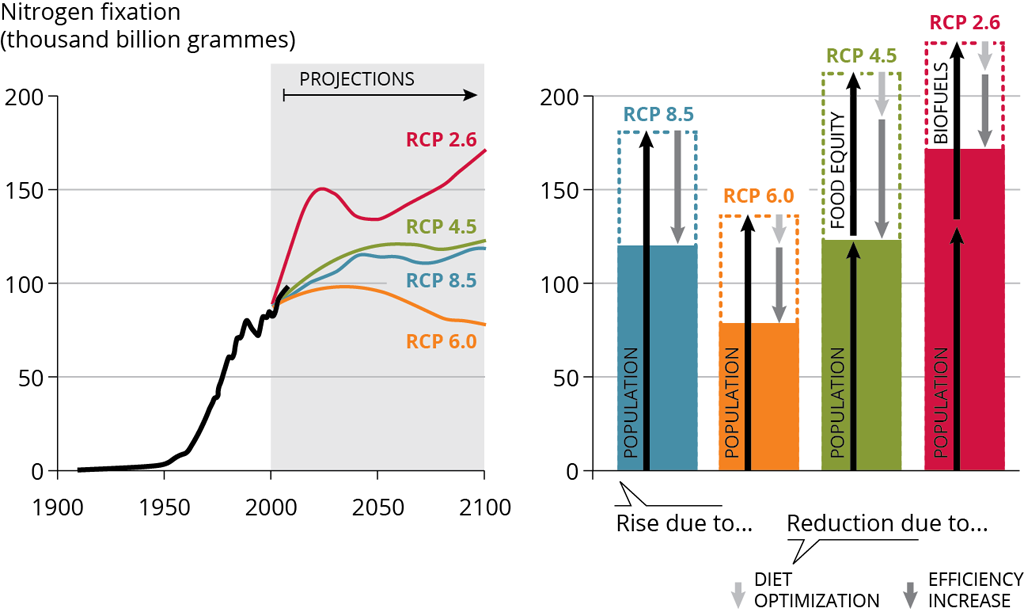
[5] Nitrogen makes up almost 80 % of the atmosphere in the form of nitrogen gases but can only be used by plants and animals if converted into another chemical form: reactive nitrogen. This process of nitrogen fixation occurs in three main ways: by lightning or high-temperature combustion (e.g. car exhausts and industrial combustion); by nitrogen-fixing plants (e.g. legumes); and by the industrial creation of synthetic nitrogen fertilisers. Reactive nitrogen is also released from animal manure.

[6] Ozone pollution as described throughout this publication refers to ozone concentrations at or near the Earth’s surface (from the surface to 12–20 kms above it, referred to as tropospheric ozone), which can have adverse impacts for humans and the natural environment. The Earth's ozone layer is mainly found in the lower portion of the stratosphere, approximately 20–30 kms above Earth.

[7] This does not apply to emissions from international shipping. Nitrogen dioxide emissions from international shipping are estimated to have increased by around 25 % for 2000–2007 only.[35]

[8] Projections of changes in the climate systems as given here utilise a new set of emissions scenarios, the representative concentration pathways (RCPs; 28). The RCPs are four scenarios for levels of atmospheric greenhouse gases in the years up to 2100. They vary from a scenario in which greenhouse gas concentrations increase moderately between now and 2100 (RCP 2.6), to scenarios with greater levels of greenhouse gas concentrations (RCPs 4.5 and 6); all the way to a scenario in which greenhouse gas concentrations increase very greatly (RCP 8.5 – the scenario toward which greenhouse gas emissions are currently heading if no further abatement measures are taken). The RCPs were developed to aid climate modelling and underpin the Fifth Assessment Report of the IPCC. They do not necessarily represent probable future socioeconomic pathways.

[9] HTAP (2010), 'Part A: Ozone and Particulate matter', Air Pollution Studies No. 17, Task Force on Hemispheric Transport of Air Pollution (HTAP), acting within the framework of the Convention on Long-range  Transboundary Air Pollution (LRTAP) of the United Nations Economic Commission for Europe (UNECE), Geneva, Switzerland.

[10] EEA (2013), Air quality in Europe – 2013 report, EEA Report 9/2013, European Environment Agency, Copenhagen, Denmark.

[11] Wild, O., Fiore, A.M., Shindell, D.T., Doherty, R.M., Collins, W.J., Dentener, F.J., Schultz, M.G., Gong, S., MacKenzie, I.A., Zeng, G., Hess, P., Duncan, B.N., Bergmann, D.J., Szopa, S., Jonson, J.E., Keating, T.J. and Zuber, A. (2012), 'Modelling future changes in surface ozone: a parameterized approach', Atmospheric Chemistry and Physics 12(4), 2037–2054.

[12] OSPAR (2010), '2010 Quality Status Report', The Convention for the Protection of the Marine Environment of the North-East Atlantic (OSPAR), London, UK.

[13] Rockström, J., Steffen, W., Noone, K., Persson, Å., Chapin, F.S., Lambin, E.F., Lenton, T.M., Scheffer, M., Folke, C., Schellnhuber, H.J., Nykvist, B., de Wit, C.A., Hughes, T., van der Leeuw, S., Rodhe, H., Sörlin, S., Snyder, P.K., Costanza, R., Svedin, U., Falkenmark, M., Karlberg, L., Corell, R.W., Fabry, V.J., Hansen, J., Walker, B., Liverman, D., Richardson, K., Crutzen, P. and Foley, J.A. (2009), 'A safe operating space for humanity', Nature 461(7263), 472–475.

[14] Winiwarter, W., Erisman, J.W., Galloway, J.N., Klimont, Z. and Sutton, M.A. (2013), 'Estimating environmentally relevant fixed nitrogen demand in the 21st century', Climatic Change 120(4), 889–901.

[15] FAO (2012), 'World agriculture towards 2030/2050: the 2012 revision', ESA Working Paper 12-03, Food and Agriculture Organization of the United Nations, Rome, Italy.

[16] OECD (2012), 'OECD Environmental Outlook to 2050', Organisation for Economic Co-operation and Development, Paris, France.

[17] Van Vuuren, D.P., Edmonds, J., Kainuma, M., Riahi, K., Thomson, A., Hibbard, K., Hurtt, G.C., Kram, T., Krey, V., Lamarque, J-F., Masui, T., Meinshausen, M., Nakicenovic, N., Smith, S.J. and Rose, S.K. (2011), 'The representative concentration pathways: an overview', Climatic Change 109(1-2), 5–31.

[18] Azevedo, L.B., van Zelm, R., Hendriks, A.J., Bobbink, R. and Huijbregts, M.A.J. (2013), 'Global assessment of the effects of terrestrial acidification on plant species richness', Environmental Pollution 174, 10–15.

[19] Dise, N.B., Ashmore, M., Belyazid, S., Bleeker, A., Bobbink, R., de Vries, W., Erisman, J.W., Spranger, T., Stevensand, C.J. and van der Berg, L. (2011), 'Nitrogen as a threat to European terrestrial biodiversity', In: Sutton, M.A., Howard, C.M.et al.(Eds.)The European Nitrogen Assessment: Sources, Effects and Policy Perspectives. pp. 463–494. Cambridge University Press, Cambridge, UK.

[20] Bobbink, R., Hicks, K., Galloway, J., Spranger, T., Alkemade, R., Ashmore, M., Bustamante, M., Cinderby, S., Davidson, E., Dentener, F., Emmett, B., Erisman, J-W., Fenn, M., Gilliam, F., Nordin, A., Pardo, L. and De Vries, W., 2010, 'Global assessment of nitrogen deposition effects on terrestrial plant diversity: a synthesis', Ecological Applications 20(1), 30–59.

[21] Vestreng, V., Myhre, G., Fagerli, H., Reis, S. and Tarrasón, L. (2007), 'Twenty-five years of continuous sulphur dioxide emission reduction in Europe', Atmospheric Chemistry and Physics 7(13), 3663–3681.

[22] Hicks, W.K., Kuylenstierna, J.C.I., Owen, A., Dentener, F., Seip, H-M. and Rodhe, H. (2008), 'Soil Sensitivity to Acidification in Asia: status and Prospects', Ambio 37(4), 295–303.

[23] Bleeker, A., Hicks, W.K., Dentener, F., Galloway, J. and Erisman, J.W., 2011, 'N deposition as a threat to the World’s protected areas under the Convention on Biological Diversity', Environmental Pollution 159(10), 2280–2288.

[24] Wedlich, K.V., Rintoul, N., Peacock, S., Cape, J.N., Coyle, M., Toet, S., Barnes, J. and Ashmore, M. (2012), 'Effects of ozone on species composition in an upland grassland', Oecologia 168(4), 1137–1146.

[25] Ashmore, M.R (2005), 'Assessing the future global impacts of ozone on vegetation', Plant, Cell and Environment 28(8), 949–964.

[26] Karnosky, D.F., Skelly, J.M., Percy, K.E. and Chappelka, A.H. (2007), 'Perspectives regarding 50 years of research on effects of tropospheric ozone air pollution on US forests', Environmental Pollution 147(3), 489–506.

[27] Jenkins, G.B., Woodward, G. and Hildrew, A. G. (2013), 'Long-term amelioration of acidity accelerates decomposition in headwater streams', Global Change Biology 19(4), 1100–1106.

[28] Rabalais, N.N., Díaz, R.J., Levin, L.A., Turner, R.E., Gilbert, D. and Zhang, J. (2010), 'Dynamics and distribution of natural and human-caused hypoxia', Biogeosciences 7(2), 585–619.

[29] Other aspects of marine pollution, such as litter (both micro particles and larger materials, e.g. plastics) are not assessed here due to space limitations.

[30] WRI (2014), Eutrophication and Hypoxia Map Data Set, World Resources Institute, Washington, DC 20002, USA, accessed August 19, 2014.

[31] Carstensen, J., Andersen, J.H., Gustafsson, B.G. and Conley, D.J. (2014), 'Deoxygenation of the Baltic Sea during the last century', PNAS 111(15), 5628–5633.

[32] van Dingenen, R., Dentener, F.J., Raes, F., Krol, M.C., Emberson, L. and Cofala, J. (2009), 'The global impact of ozone on agricultural crop yields under current and future air quality legislation', Atmospheric Environment 43(3), 604–618.

[33] UNEP and WMO (2011), 'Integrated Assessment of Black Carbon and Tropospheric Ozone', United Nations Environment Programme, Nairobi, Kenya and World Meteorological Organization, Geneva, Switzerland.

[34] UNEP (2012), 'The Global Chemicals Outlook: Towards Sound Management of Chemicals', United Nations Environment Programme, Nairobi, Kenya.

Additional information

IMO (2009), Second IMO GHG Study 2009 (Eds. Buhaug, O., Corbett, J.J., Endresen, O., Eyring, V., Faber, J., Hanayama, S., Lee, D.S., Lee, D., Lindstad, H., Markowska, A.Z., Mjelde, A., Nelissen, D., Nilsen, J., Palsson, C., Winebrake, J.J., Wu, W. and Yoshida, K.), International Maritime Organization, London, UK.

Permalinks

Geographic coverage

Temporal coverage

Topics