Key messages
- EU demand for many raw materials is increasing. This will make meaningfully reducing pollution a challenge over the coming decades.
- However, some raw material extraction — such as for fossil fuels — is expected to drastically reduce in the future.
- Between 2010 and 2019, pollution due to resource extraction fell in the EU, including fine particulate matter (PM2.5) emissions, which dropped by 17%. Nitrogen oxide emissions increased by 16%, however, and heavy metal emissions remained rather stable, with cadmium and chromium emissions slightly increasing.
- Efforts to remediate contaminated extraction sites are considered inadequate overall.
- The EU partially relies on raw material imports to meet demand. The pollution footprint associated with extracting these materials is not easily quantified — but is considered significant.
Guidance for interpreting the summary
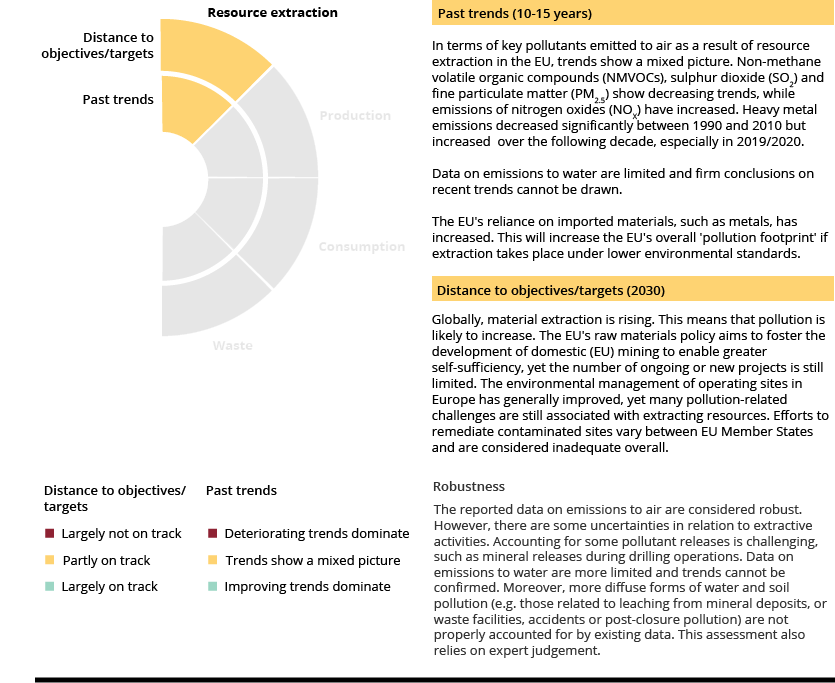
The figure above summarises the overall findings on resource extraction. Two dimensions are considered:
- whether the recent trend in pollution is positive, negative or uncertain
- the current 'distance to target', based on an assessment of the current trends or status and whether or not the EU is on track to achieve the zero pollution targets for 2030 and/or other relevant policy targets.
The assessment is based on a combination of (1) available indicators and data, and (2) expert judgement.
Introduction
Resource extraction lies at the start of the current ‘linear’ resource use model. The extraction component of the production and consumption chain is typically responsible for a significant share of a product’s environmental impacts throughout its life cycle — generating pollution that harms air quality, soils and water bodies. The nature of the pollution and the ultimate environmental impact strongly depend on the materials extracted. For example, mining precious metals can be more polluting than extracting other materials. The impacts also depend on the extraction practices employed — be they open-pit mining, underground mining or offshore drilling, etc. — and the types of technologies used. Pollutants released from resource extraction activities include acids, heavy metals, suspended solids/silts and chemicals.
The ways in which residual, extractive wastes are handled are also crucial. Considerable amounts of waste can be produced during extraction and processing. This is especially the case for commodities such as metals (EC, 2021a), where substances in residual sludge can leach into water and soils. For oil and gas extraction, significant pollution to air and water can come from venting and flaring operations[1]; for sea-based extraction, significant pollution can arise when slurry is returned to deep water. Additional emissions from resource extraction are linked to energy use, processing and transport.
Pollution remains a risk long after an activity ends. Diffuse pollution can be extensive at mine sites; therefore, reclamation is often limited. Europe has a large legacy of abandoned mines (Dolega et al., 2016) and these facilities constitute some of the highest environmental risks in Europe (Bide et al., 2019). This is compounded by the fact that legacy site regulation can be less stringent than regulation for new polluting activities (Payá Pérez and Rodriguez Eugenio, 2018).
Finally, specific pollution incidents caused by accidents can be serious and difficult to quantify, and such cases have some of the highest environmental impacts (Dolega et al., 2016). This is the case for oil spills (see further information in the zero pollution ‘Signal’ on oil spills) and tailings dam failures (see GRID-Arendal and UN-Spider portal for further information).
Impacts of imported materials and increasing material demand
The EU is almost self-sufficient regarding non-metallic minerals, such as construction materials. However, it relies heavily on extraction from other parts of the world for other materials, including fossil fuels and metals (EC, 2021a). For example, 68% of the EU’s cobalt is sourced from the Democratic Republic of the Congo, and, prior to the war in Ukraine, 30% of the EU’s fuel was sourced from Russia. As a result, EU demand for resources extracted in other parts of the world contributes to pollution in other global regions. Part of the problem is that environmental practices elsewhere can be less stringent than those in the EU. It is estimated that, globally, the toxicity-related impacts of extracting and processing metal ores and extracting non-metallic minerals increased, respectively, by around 50% and 40% between 2000 and 2015 (IRP, 2019).
In addition to the dramatic increase in material demand seen over the last two decades, global demand for materials is expected to continue to grow, which will lead to further extraction (IRP, 2019). This will inevitably increase pollution around the world. Expanding infrastructure, increasing housing needs to serve a growing world population, increasing living standards (IRP, 2019) and increasing needs for materials that facilitate low-carbon transitions drive this demand. Fossil fuels are the only resource type for which demand is slowing down: demand for these fuels is expected to drastically fall in the EU, in line with its long-term commitment to achieve climate neutrality.
In this context, one of the pillars of EU raw materials policy is to boost domestic material production from both virgin and recycled sources. New projects for mining precious metals, graphite, zinc, copper, tungsten and manganese have been developed. Numerous exploration activities are taking place and the EU has potential for even more (EC, 2021a). Because of the increasing demand for batteries — which play a key role in meeting the net-zero climate targets — four lithium mines have recently become active in the EU (EC, 2021a). In addition, the European Commission’s 2021 strategic foresight report suggests that novel ways of material sourcing, such as seabed mining, should be explored (EC, 2021b). However, this gives rise to environmental concerns, as the impacts of seabed mining are difficult to predict.
The increased demand for materials and the move towards greater self-sufficiency within the EU have complex implications for pollution. On the one hand, these two phenomena are likely to increase pollution from extractive industries in Europe. On the other hand, switching from imported to EU-sourced raw materials could result in lower global levels of pollution. Moreover, the EU is promoting better resource efficiency and the circular use of materials, which will reduce the demand for virgin material extraction — and, ultimately, reduce the resulting pollution.
Effective waste management, proper reclamation, and good management and monitoring systems are key to reducing pollution from resource extraction. These elements should be supported by other measures, including improved material use efficiency. Overall, reducing raw material consumption and improving resource efficiency and recycling are critical for minimising pollution. To support this, the uptake of circular business models (as set out in the circular economy agenda) should be prioritised.
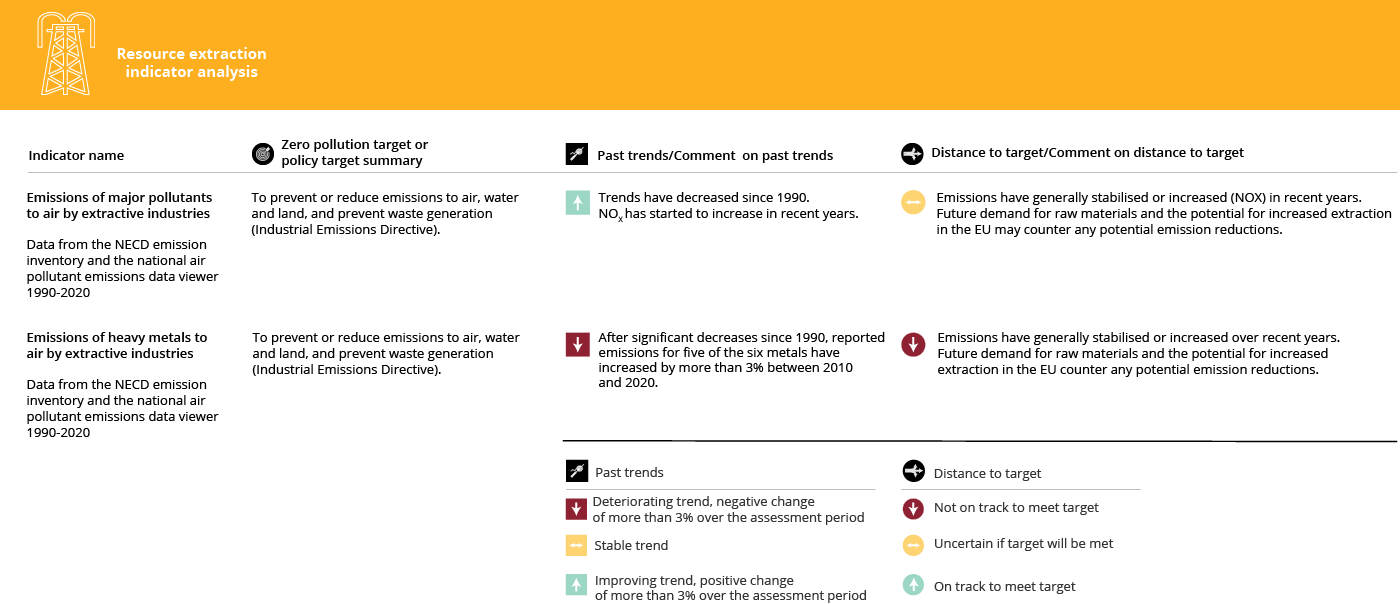
Pollutant emissions from extractive industries
Of the air pollutants regulated in the EU because of their potential to harm health and the environment, non-methane volatile organic compounds (NMVOCs) — mostly manifesting as fugitive emissions from coal, oil and natural gas extraction — are the most emitted by mass. The other key pollutants, sulphur dioxide (SO2) and nitrogen oxides (NOX), primarily arise from venting and flaring. Meanwhile, fine particulate matter (PM2.5) mostly originates from quarrying and mining minerals other than coal.
Data show that air pollution from the extractive sector (Figure 3) has significantly decreased over recent decades. The decrease was slower over the last ten years, during which NOX emissions also increased. The overall reduction has most likely been the result of more effective control of pollution in the sector: emissions decreased despite resource extraction remaining stable, or even increasing in the case of metal production. For oil and gas, the reduction may also result from decreasing fossil fuel extraction.
Note: The figure shows air pollutant emission inventory data reported to the EEA by EU Member States under the National Emission Reduction Commitments Directive (NECD), 1990-2020, available from the EEA’s National air pollutant emissions data viewer (consulted 7 October 2022). The figure includes releases from the following nomenclature for reporting (NFR) sectors: NFR 1b1a, 1B1c, 1B2ai, 1B2b, 1B2C and 2A5a. Ammonia (NH3) emissions are not included because of low values.
Sources: EEA (2022).
Click here for different chart formats and data
For heavy metals, zinc, nickel and cadmium are currently the main pollutants emitted to air from the extractive sector, followed by chromium (Figure 4). In the 1990s, mercury and lead emissions were among the main releases. Zinc, nickel and cadmium emissions result from venting and flaring in the extraction of oil and gas. Emissions also come from mining and quarrying, and oil and natural gas exploration. Emissions decreased significantly between 1990 and about 2005, but significant increases occurred between 2006 and 2008 for some heavy metals. Over the last decade, and especially between 2019 and 2020, releases have increased for all heavy metals covered here.
Note: The figure shows air pollutant emission inventory data reported to the EEA by EU Member States under the Gothenburg Protocol (Convention on Long-range Transboundary Air Pollution), 1990-2020, available from the EEA’s Air pollutant emissions data viewer (consulted 7 October 2022). The figure includes releases from the following nomenclature for reporting (NFR) sectors: NFR 1b1a, 1B1c, 1B2ai, 1B2b, 1B2C and 2A5a.
Source: EEA (2022).
Click here for different chart formats and data
Contaminated sites caused by extractive activities
The zero pollution monitoring assessment on soils and health identifies increased risks to health for people living near contaminated sites. Mining materials, oil extraction and oil storage are important sources of contamination, as shown by Figure 5. The figure shows the percentage of contaminated sites that are linked to these extractive activities, compared to the total number of sites where soil contamination has been verified by site investigations. However, these data should be interpreted with caution, since the efforts in identifying and registering contaminated sites vary among countries. For the moment, data that can be used to monitor trends are scarce (Payá Pérez and Rodríguez Eugenio, 2018) and many contaminated sites in Europe are still not registered or monitored and/or have not been remediated. Better monitoring can be expected in the coming years.
Apart from the situation in the EU, a lack of remediation and existing legacy mine sites are also the source of major pollution issues in many other countries (e.g. in Chile, Peru, South Africa and sub-Saharan African countries) (Schueler et al., 2018).
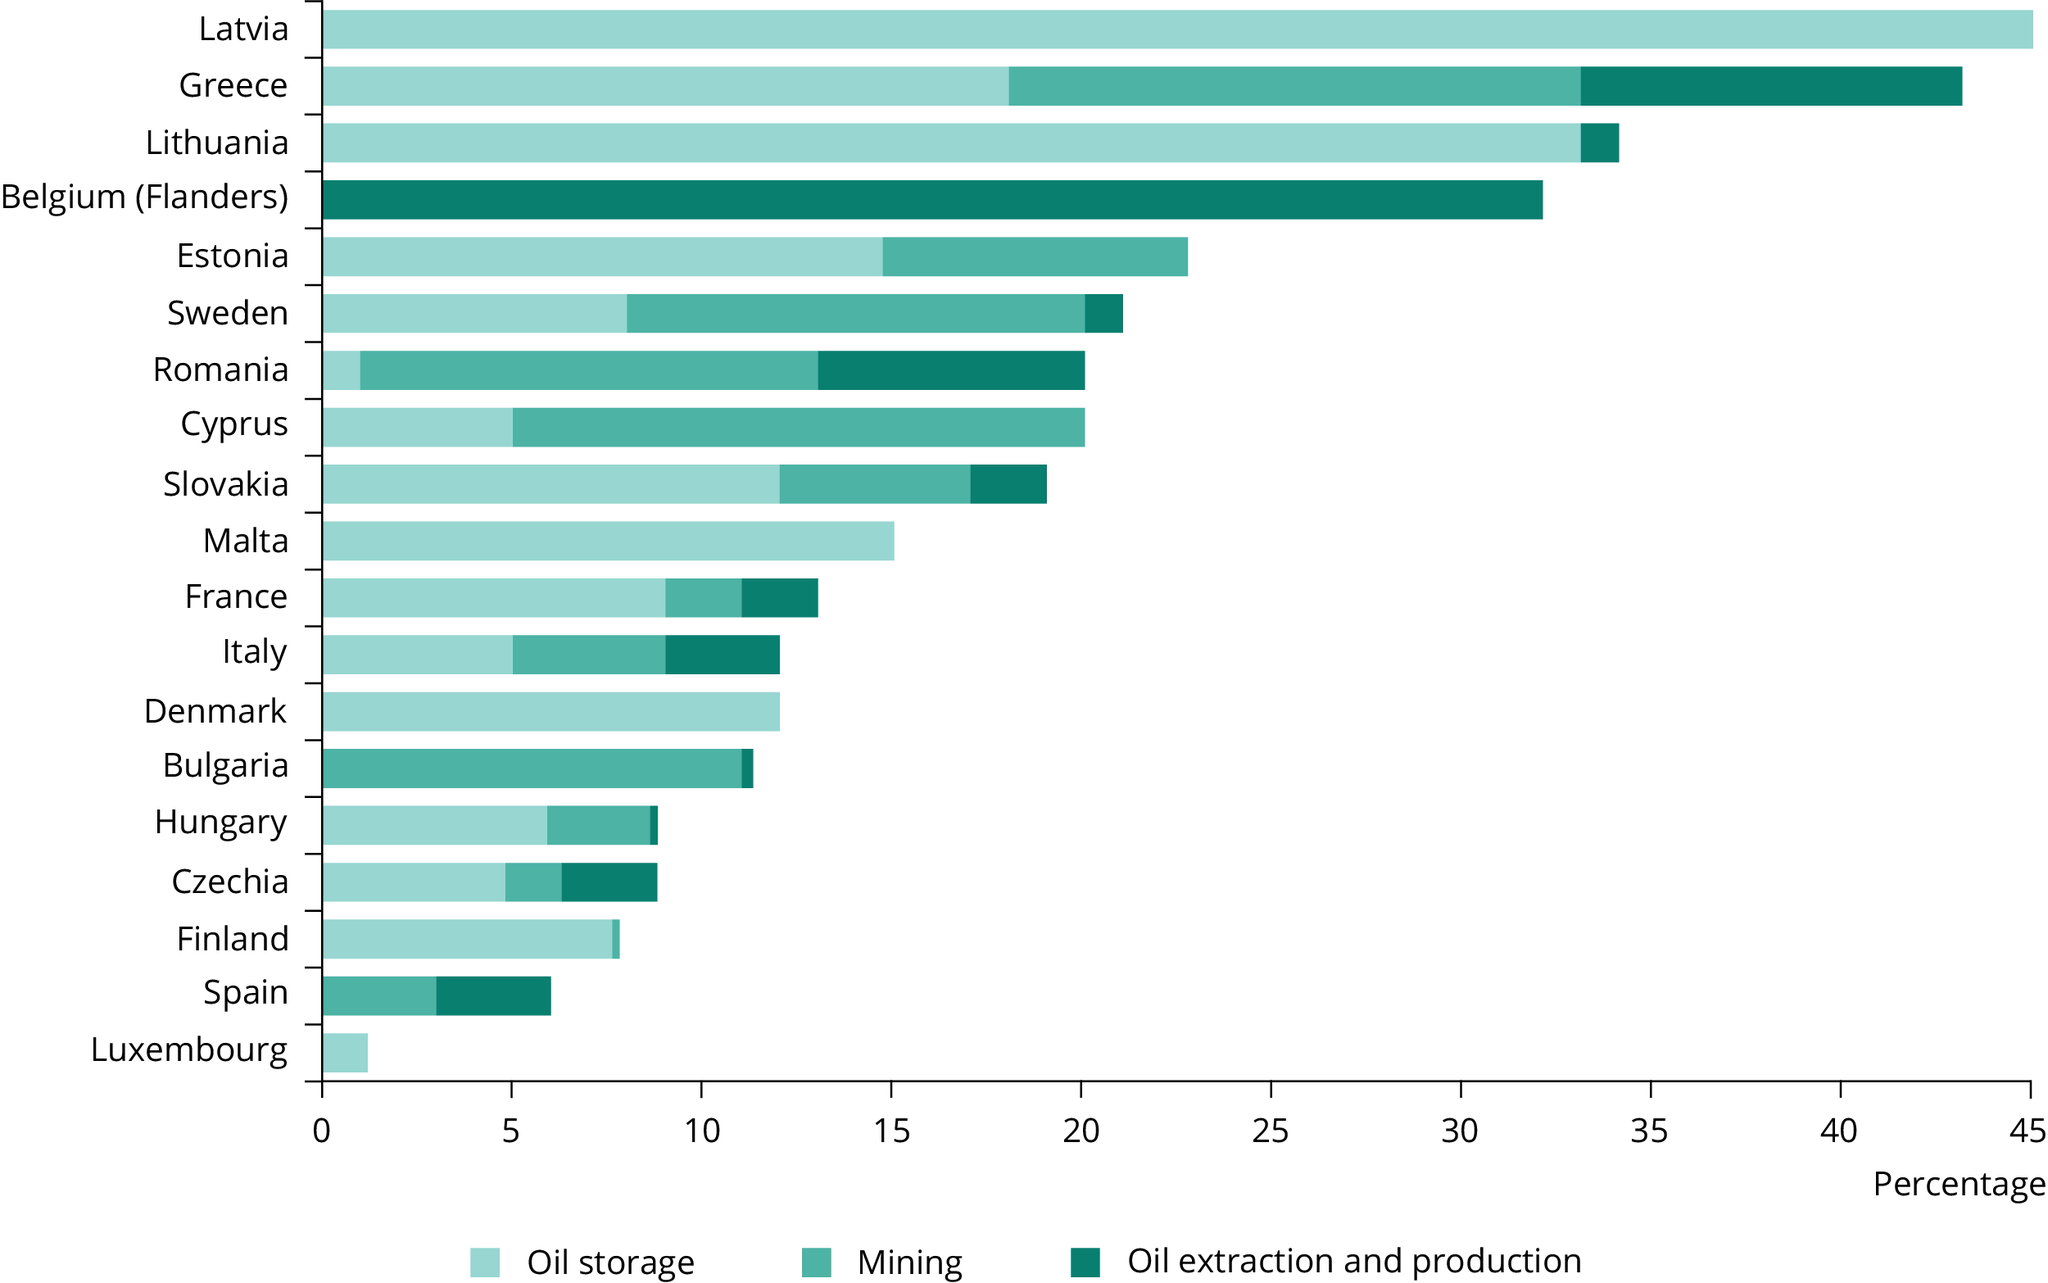
Note: Data are only available for some EU countries, and are not currently suitable for monitoring trends. The data reflects the percentage of all reported contaminated sites, without considering site size or the type of activity. Sites are locations where soil contamination has been verified by site investigations.
Source: Data are mainly derived from the 2011 questionnaire on contaminated sites (methodology described in Van Liedekerke et al., 2014). Data from the 2006 questionnaire are used where data from 2011 are missing or not fully reliable, which is the case for Bulgaria, Czech Republic, Denmark, Greece, Hungary, Luxembourg, Romania, Spain, Sweden.
Click here for different chart formats and data
Note: Link to indicators: NECD emission inventory, national air pollutant emissions data viewer 1990-2020.
Overview of indicator analysis methodology
This indicator analysis is in line with the approach taken by the EEA for its seventh environment action programme monitoring.
Past trends are based on assessment of the trend over the last 10 years (or since the relevant zero pollution baseline year where appropriate) with green, yellow or red being applied based on the criteria as outlined in the figure legend. Expert judgement is also applied, for example in cases where indicators are more qualitative and/or uncertain.
The distance to target is based on an assessment of the recent trend, current status and expert judgement.
Further detailed analysis of the future outlook for meeting certain zero pollution targets is included in the zero pollution outlook 2022, completed by the European Commission Joint Research Centre (JRC, 2022).
Notes
[1] These operations are controlled processes aimed at disposing of waste gas when it is not possible to use, export or re-inject it. Flaring is the burning of gas and venting is the release of unburned gas.
References
Bide, T. et al., 2019, Deliverable 1.3 — report on the datasets available relating to social and environmental dimensions of extraction, Optimizing Quality of Information in Raw Material Data Collection across Europe — ORAMA, European Union (https://orama-h2020.eu/wp-content/uploads/ORAMA_WP1_DEL1.3_20190329_BGS_v1.0.pdf) accessed 10 October 2022.
Dolega, P., et al., 2016, Outlining environmental challenges in the non-fuel mining sector, STRADE European Policy Brief No 04/2016, European Union (http://stradeproject.eu/fileadmin/user_upload/pdf/PolicyBrief_04-2016_Sep2016_FINAL.pdf) accessed 10 October 2022.
EC, 2021a, 3rd raw materials scoreboard, Directorate-General for Internal Market, Industry, Entrepreneurship and SMEs, European Commission, Brussels (https://op.europa.eu/s/we5N) accessed 10 October 2022.
EC, 2021b, 2021 Strategic Foresight Report — the EU’s capacity and freedom to act, European Commission (https://ec.europa.eu/info/sites/default/files/strategic_foresight_report_2021_en.pdf) accessed 10 October 2022.
EEA, 2022, ‘National air pollutant emissions data viewer’, European Environment Agency (https://www.eea.europa.eu/data-and-maps/dashboards/national-air-pollutant-emissions-data) accessed 7 October 2022.
IRP, 2019, Global resources outlook 2019: natural resources for the future we want, International Resource Panel, Paris (https://www.resourcepanel.org/reports/global-resources-outlook) accessed 10 October 2022.
JRC, 2022, Zero pollution outlook 2022, JRC129655, Publications Office of the European Union, Luxembourg, Joint Research Centre (https://joint-research-centre.ec.europa.eu/zero-pollution-outlook-2022_en) accessed 1 December 2022.
Payá Pérez, A. and Rodriguez Eugenio, N., 2018, Status of local soil contamination in Europe: revision of the indicator ‘Progress in the management contaminated sites in Europe’, JRC Technical Report JRC107508, Publications Office of the European Union, Luxembourg (http://dx.doi.org/10.2760/093804).
Schueler, D., et al., 2018, Socio-economic and environmental challenges in EU mineral supply: status-quo and fields of EU action, Paper for the Final STRADE conference, European Union (https://www.stradeproject.eu/fileadmin/user_upload/pdf/STRADE__synthesis_env_social_challenges.pdf) accessed 10 October 2022.
Van Liedekerke, M., et al., 2013, Progress in the Management of Contaminated Sites in Europe, Publications Office of the European Union (https://publications.jrc.ec.europa.eu/repository/handle/JRC85913) accessed 27 October 2022.
Cover image source: © Mateo Puđa, Well with Nature /EEA

Document Actions
Share with others