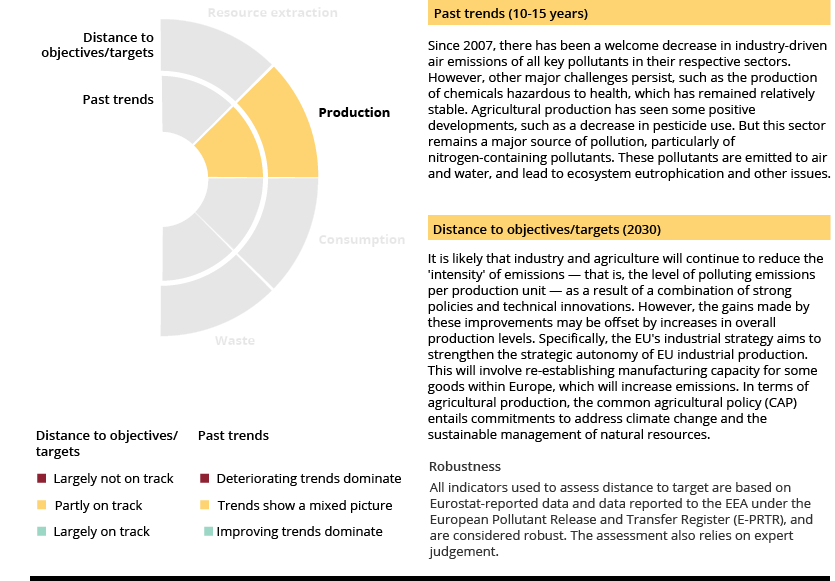
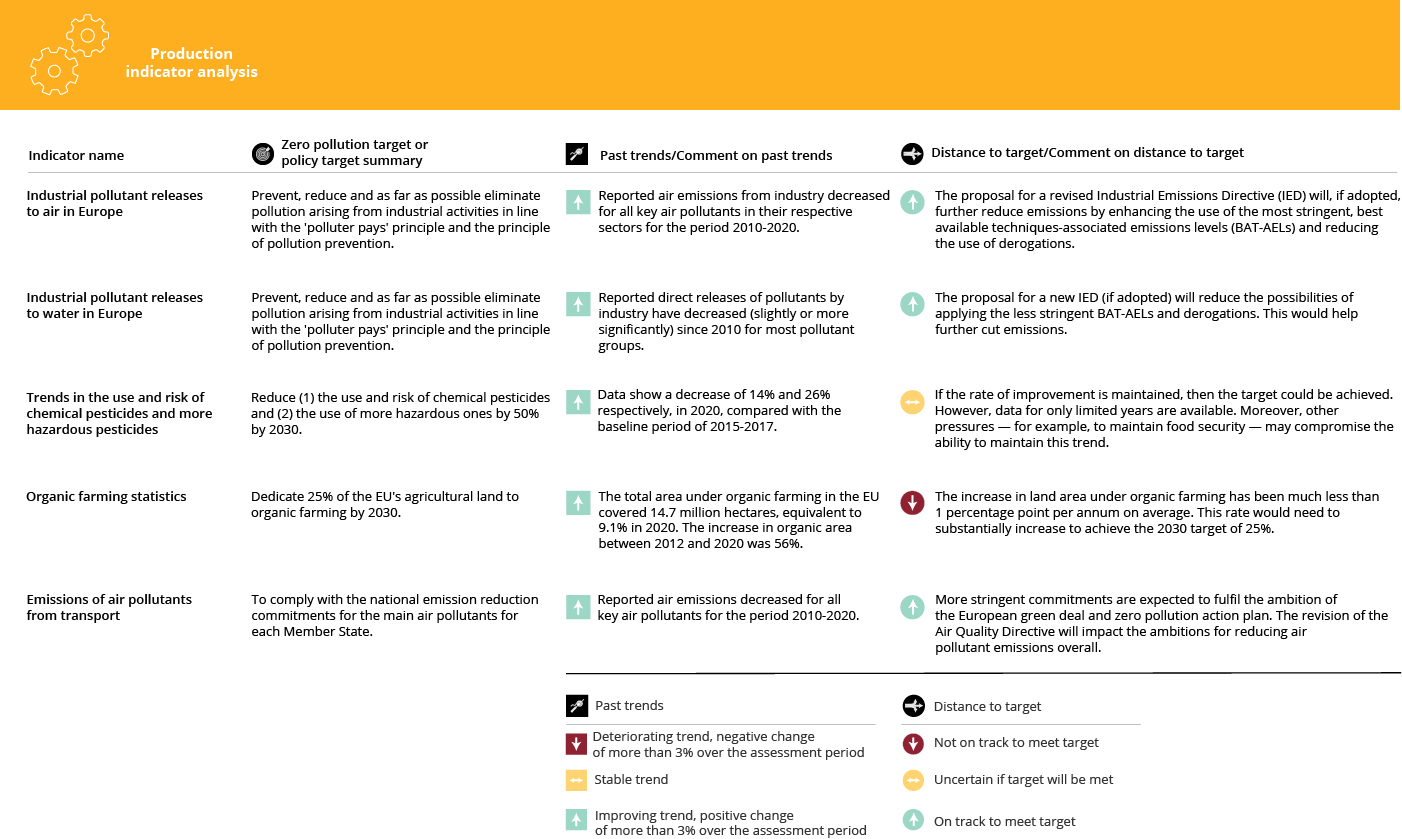
Key messages
- Intensive production and agricultural practices within the EU, along with production abroad driven by EU demand, significantly pollute air, land and water.
- Emissions to air from production have fallen because of EU policies, with partial decoupling from economic activity. For example, emissions of coarse particulate matter (PM10) and sulphur oxides (SOX) have fallen by around 70% in the last decade.
- Nitrogen and phosphorus make up about 98% of pollution released to surface waters. Nutrient losses from agriculture show no signs of decreasing towards the zero pollution target of a 50% reduction by 2030.
- Relatively little progress has been made in reducing resource use and emissions from the agriculture sector.
- The use and risk of chemical pesticides decreased by 14% from the baseline period (2015-2017) to 2020. Moreover, the use of more hazardous chemical pesticides declined by 26% during the same period.
Guidance for interpreting the summary
The figure above summarises the overall findings on production. Two dimensions are considered:
- whether the recent trend in pollution is positive, negative or uncertain
- the current 'distance to target', based on an assessment of the current trends or status, and whether or not the EU is on track to achieve the defined zero pollution targets for 2030 and/or other relevant policy targets.
The assessment is based on a combination of (1) available indicators and data, and (2) expert judgement.
Introduction
The manufacture of goods is a key part of Europe’s production activity and occurs in large and small factories across the continent. Production also includes agriculture, which is significant in terms of both its scale and the associated pollution risks. The processes involved in providing the goods that we use range from simple assembly operations to complex industrial activities involving toxic and persistent chemicals. All of these activities result in some kind of emissions. Therefore, production can be a significant source of pressure on the environment — with the potential to cause serious pollution if not carefully managed.
Environmental pressures from production include direct emissions to air, water and soil. These arise across all production sectors, and some sectors are more strongly associated with emissions of certain pollutants than others. For example, ammonia releases are strongly linked to agricultural activity, and a significant portion of sulphur dioxide emissions is associated with energy supply — primarily coal burning. Other types of pollution resulting from production include excessive noise, elevated or misdirected light levels, and the degradation of natural ecosystems through agriculture and urban sprawl.
Emissions from industrial production
Industrial production volumes continue to increase in Europe and are supplemented by international trade. These activities entail using resources, including mined raw materials and recycled materials, and demand a significant amount of energy to power facilities and processes. The Industrial Emissions Directive (IED) is a critical piece of legislation that aims to significantly protect human health and the environment by reducing harmful industrial emissions across the EU, particularly through the better application of best available techniques (BATs). Under the IED, approximately 50,000 industrial installations must operate in accordance with a permit granted by national regulatory authorities.
In recent years, European industry has become less emission intensive (see Figures 9 and 10). At the same time, industry has generated more value for the economy — indicating that production and environmental impacts have become at least partially decoupled. This is the result of a combination of strict environmental policy and regulation in the EU, along with other factors such as technological innovations and changing consumer demand. Examples of the costs and benefits of regulatory initiatives for industry are explored in the zero pollution ‘Signal’ on reducing pollution from Europe’s industrial facilities.
Pollution from European industry has generally decreased during the last decade and is expected to continue to do so. However, industry is still responsible for a significant share of the pollution in the European environment. Industry has a critical role to play in reducing pollution by implementing approaches that ‘design out’ pollution. The principles described in the EU’s circular economy action plan, zero pollution action plan and chemicals strategy for sustainability provide a framework for maximising the use of materials and products. For example, the EU’s chemicals strategy for sustainability aims to better protect human health and the environment as part of efforts to achieve the broader zero pollution targets. A key component of this strategy is the development of ‘safe and sustainable by design’ criteria for chemicals (as described in the zero pollution ‘Signal’ on safe and sustainable by design). This concept is designed to ensure the safety, sustainability and functionality of chemicals, products and processes along their entire life cycles; the ultimate goal is to minimise products’ environmental impacts and encourage material reuse (Caldeira et al., 2022).
It should also be noted that, over time, some industrial operations have relocated to countries outside the EU. This may mean that Europe has simply outsourced some of its pollution to other, less stringently regulated countries. Recent EU policies around re-establishing manufacturing capacity to drive economic growth and mitigate vulnerability to global supply chains are expected to at least partially reverse this trend — and accelerate growth in manufacturing in Europe. Prospects for manufacturing growth in the EU up to 2030 are strong (Eurofound, 2019).
Chemical production and use are areas of particular concern from a zero pollution perspective — in terms of both the sheer volume of chemicals in use and the potential combined toxicity of harmful substances. Eurostat data (2021a) indicate that there has been a slight decrease in the proportion of total chemicals produced that are classified as hazardous to health, compared with a 2004 baseline (Figure 8). This could be the result of specific measures taken to avoid producing and using such chemicals and to replace them with less hazardous ones. However, the total amount of chemicals produced that are hazardous to health has remained relatively stable during this period. The trend for manufacturing to move to developing countries means that is it likely that European consumption still continues to drive chemical production (and pollution), but that this now occurs in other global locations and is outside EU regulatory oversight. New issues related to pollution from chemical production are potentially emerging. These include the emergence of novel substances whose properties may not be fully understood; issues related to the regulation and management of nanomaterials; and the growth in chemical recycling techniques for the treatment of end-of-life materials.
Note: Data are referenced to a 2004 baseline.
Source: Eurostat (2022a).
Click here for different chart formats and data
In general, more progress has been made in reducing industrial emissions to air than to water. For example, industrial releases of SOX and PM10 decreased by 72% and 68%, respectively, in the EU between 2010 and 2020, as demonstrated in Figure 9. Other emissions decreased to a lesser extent: CO2 by 24%, NOX by 41% and heavy metals (Cd, Hg and Pb) by 56%.
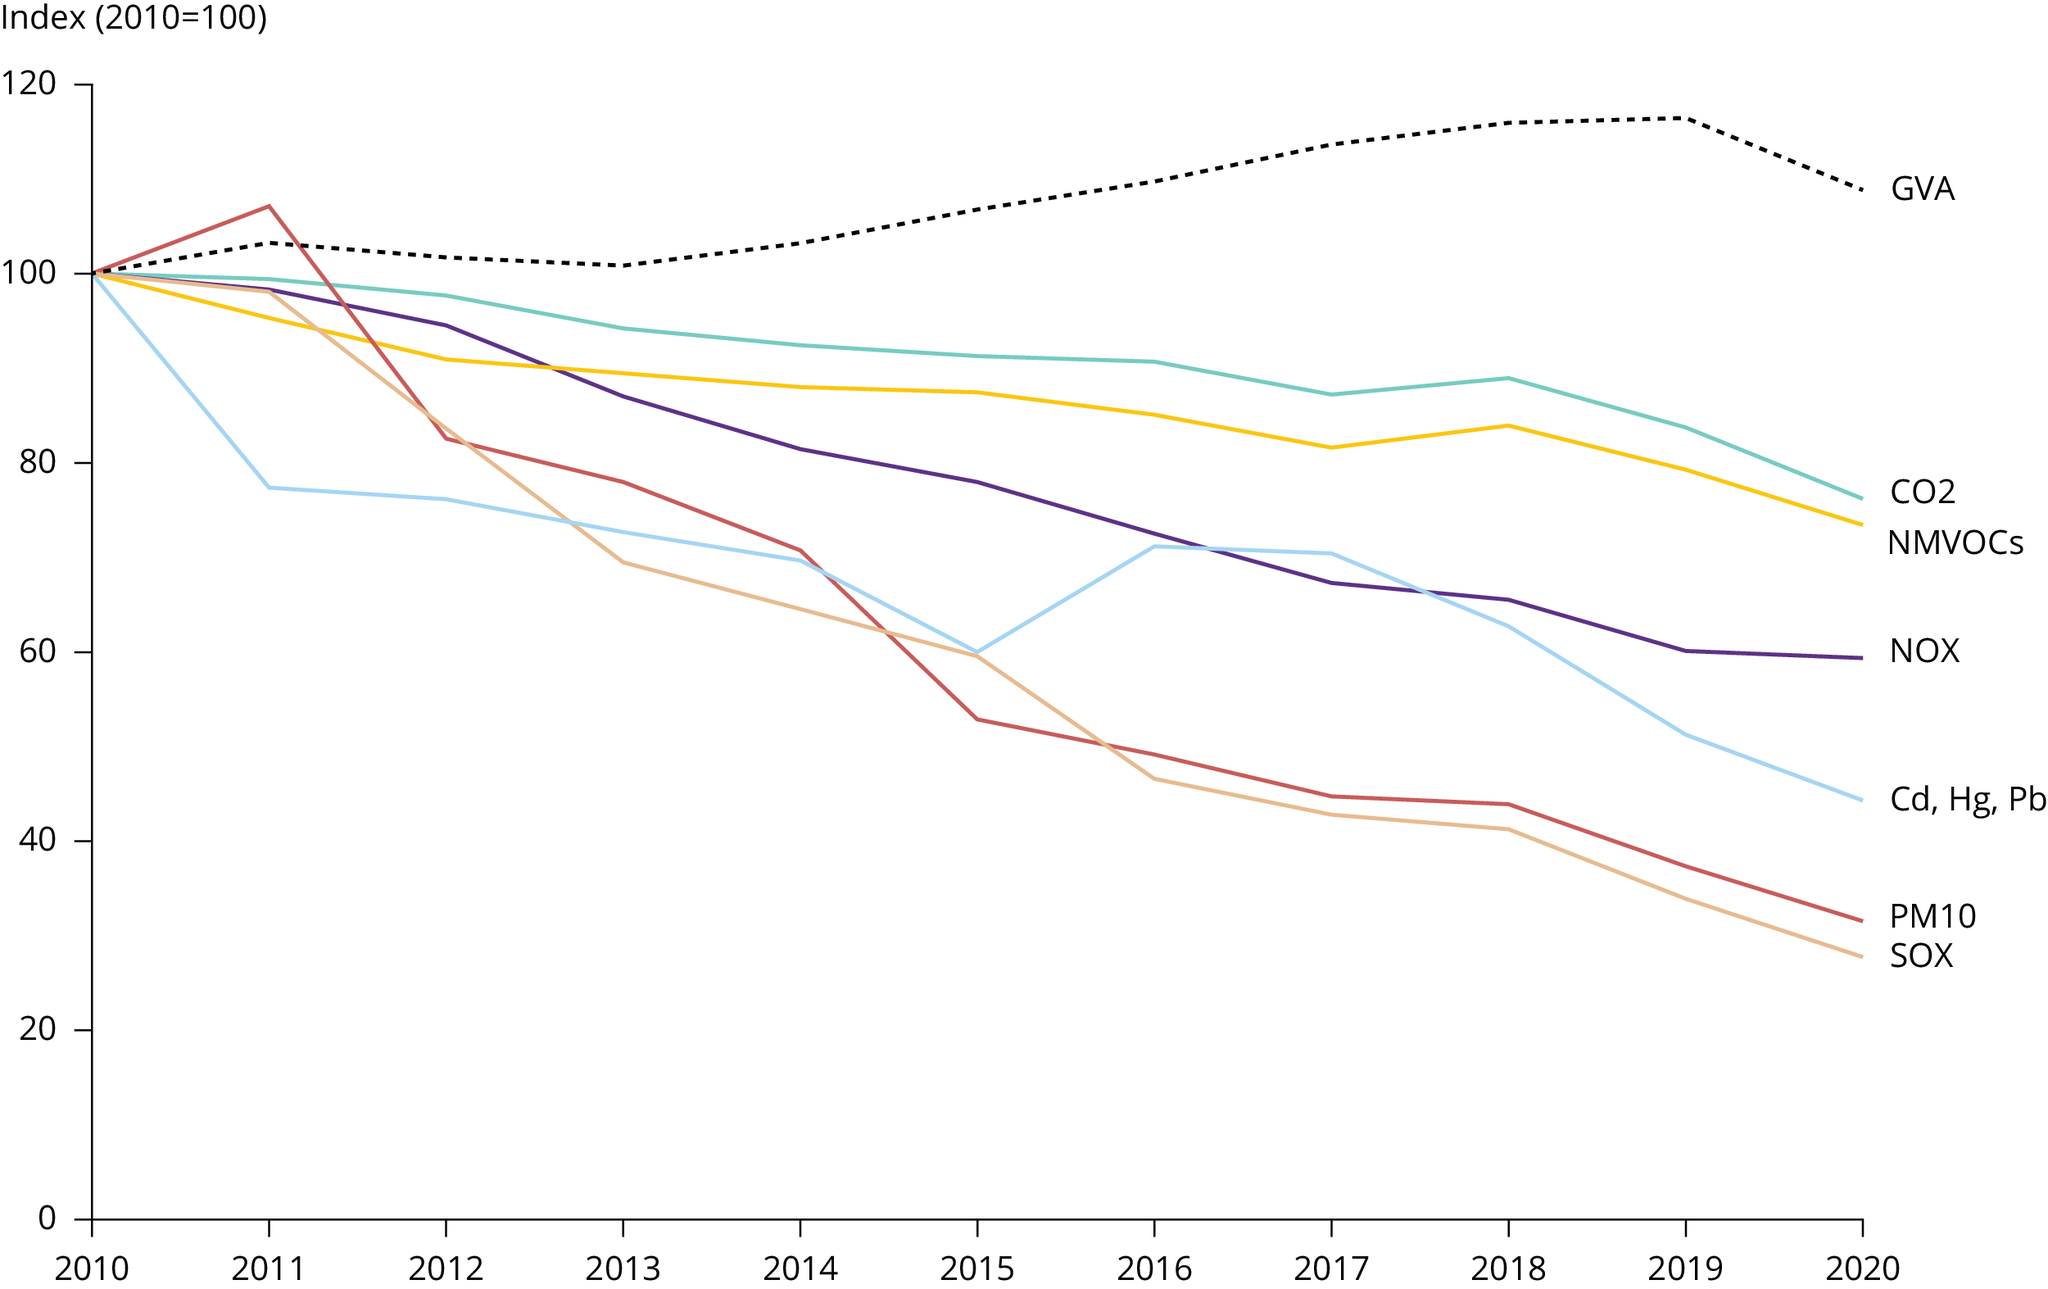
Note: Economic activity represented by gross value added (GVA). CO2 = carbon dioxide. NMVOCs = non-methane volatile organic compounds. NOX = nitrogen oxides. Cd = cadmium. Hg = mercury. Pb = lead. PM10 = particles with an aerodynamic diameter less than or equal to a nominal 10 micrometres. SOX = sulphur oxides.
Source: Adapted from EEA (2022a).
Click here for different chart formats and data
Inorganic substances account for the vast majority of pollutants in surface waters. Nitrogen and phosphorus are particularly important, accounting for about 98% of the total by mass. Data analysis indicates that chemical production was responsible for more than half of direct, inorganic chemical releases in recent years — followed by urban wastewater treatment plants and extractive industries (around 20% each). The data presented in Figure 10 indicate that releases of pollution to water is also becoming decoupled from economic activity.
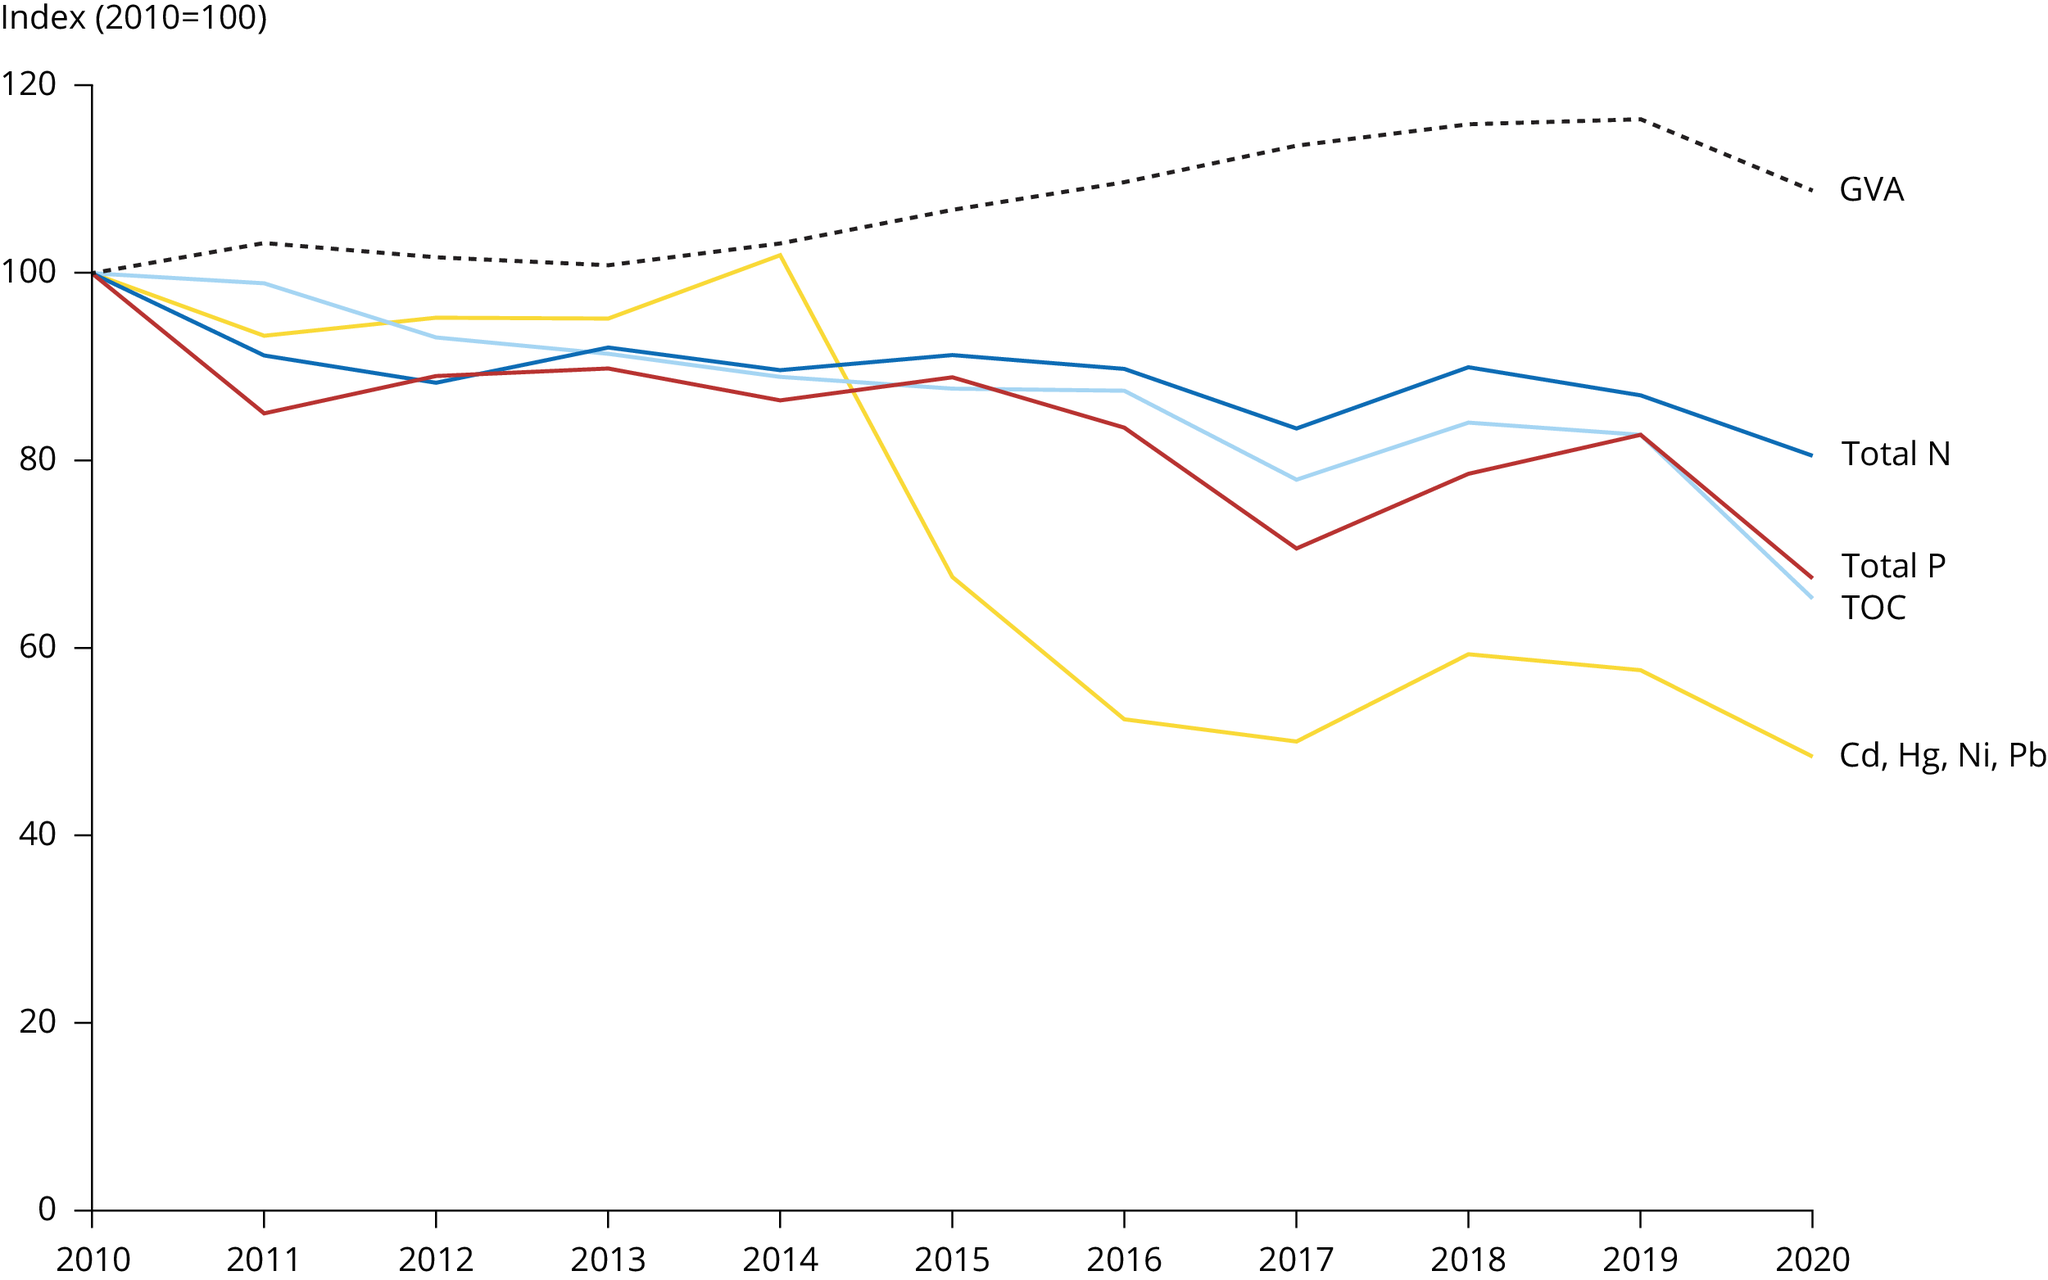
Notes: Economic activity represented by gross value added (GVA). Total N = Total nitrogen. Total P = total phosphorous. TOC = total organic carbon. Cd = cadmium. Hg = mercury. Ni = nickel. Pb = lead.
Source: EEA (2022b).
Click here for different chart formats and data
Emissions from agriculture
Agricultural activities in Europe impact the environment, the climate and human health in multiple ways. Unsustainable farming practices can pollute soil, water, air and food; they can also lead to the overexploitation of natural resources, biodiversity loss and ecosystem degradation. The key types of pollution associated with food production are nutrient run-off to waterbodies due to excess fertiliser application; ammonia releases to air from livestock manure; and mineral fertiliser releases into the atmosphere (Figure 11).
Source: EEA (2021c).
Click here for different chart formats and data
Limited progress has been made in recent years in reducing nutrient losses from the agriculture sector. Ammonia emissions to air have, for example, remained stable for the past decade, while diffuse pollution pressures are expected to continue as a result of intensive agricultural practices. The lack of progress indicates that achieving the targets set out in the farm to fork strategy and the zero pollution action plan will be challenging, as discussed below in relation to the target to reduce nutrient losses.
Assessment of zero pollution nutrient loss target
The zero pollution action plan sets a target to reduce nutrient losses by 50% by 2030. The primary source of these nutrient losses is the agricultural production system, specifically run-off from agricultural land from the use of fertilisers and ammonia emissions from livestock farming. No specific indicator currently monitors progress towards this target. However, a range of proxy information can be used to report on progress towards reducing nutrient losses, as presented below. The specific impacts of nutrient pollution are examined in more detail in the sections on health and ecosystems.
- Trends in nutrient, namely nitrogen and phosphorus, levels up to 2019 do not indicate any significant reduction in nutrient loading in surface waterbodies in general. Moreover, the percentage of groundwater monitoring stations detecting exceedances of the drinking water standard limit value for nitrogen has increased slightly over the last two monitoring periods, as discussed in the ecosystems and freshwater assessment.
- In some cases, nutrient inputs have reduced; for example, there have been modest reductions in ammonia deposition to land, reducing the area at risk of eutrophication.
- Mineral fertiliser consumption increased between 2010 and 2018, as illustrated in Figure 18.
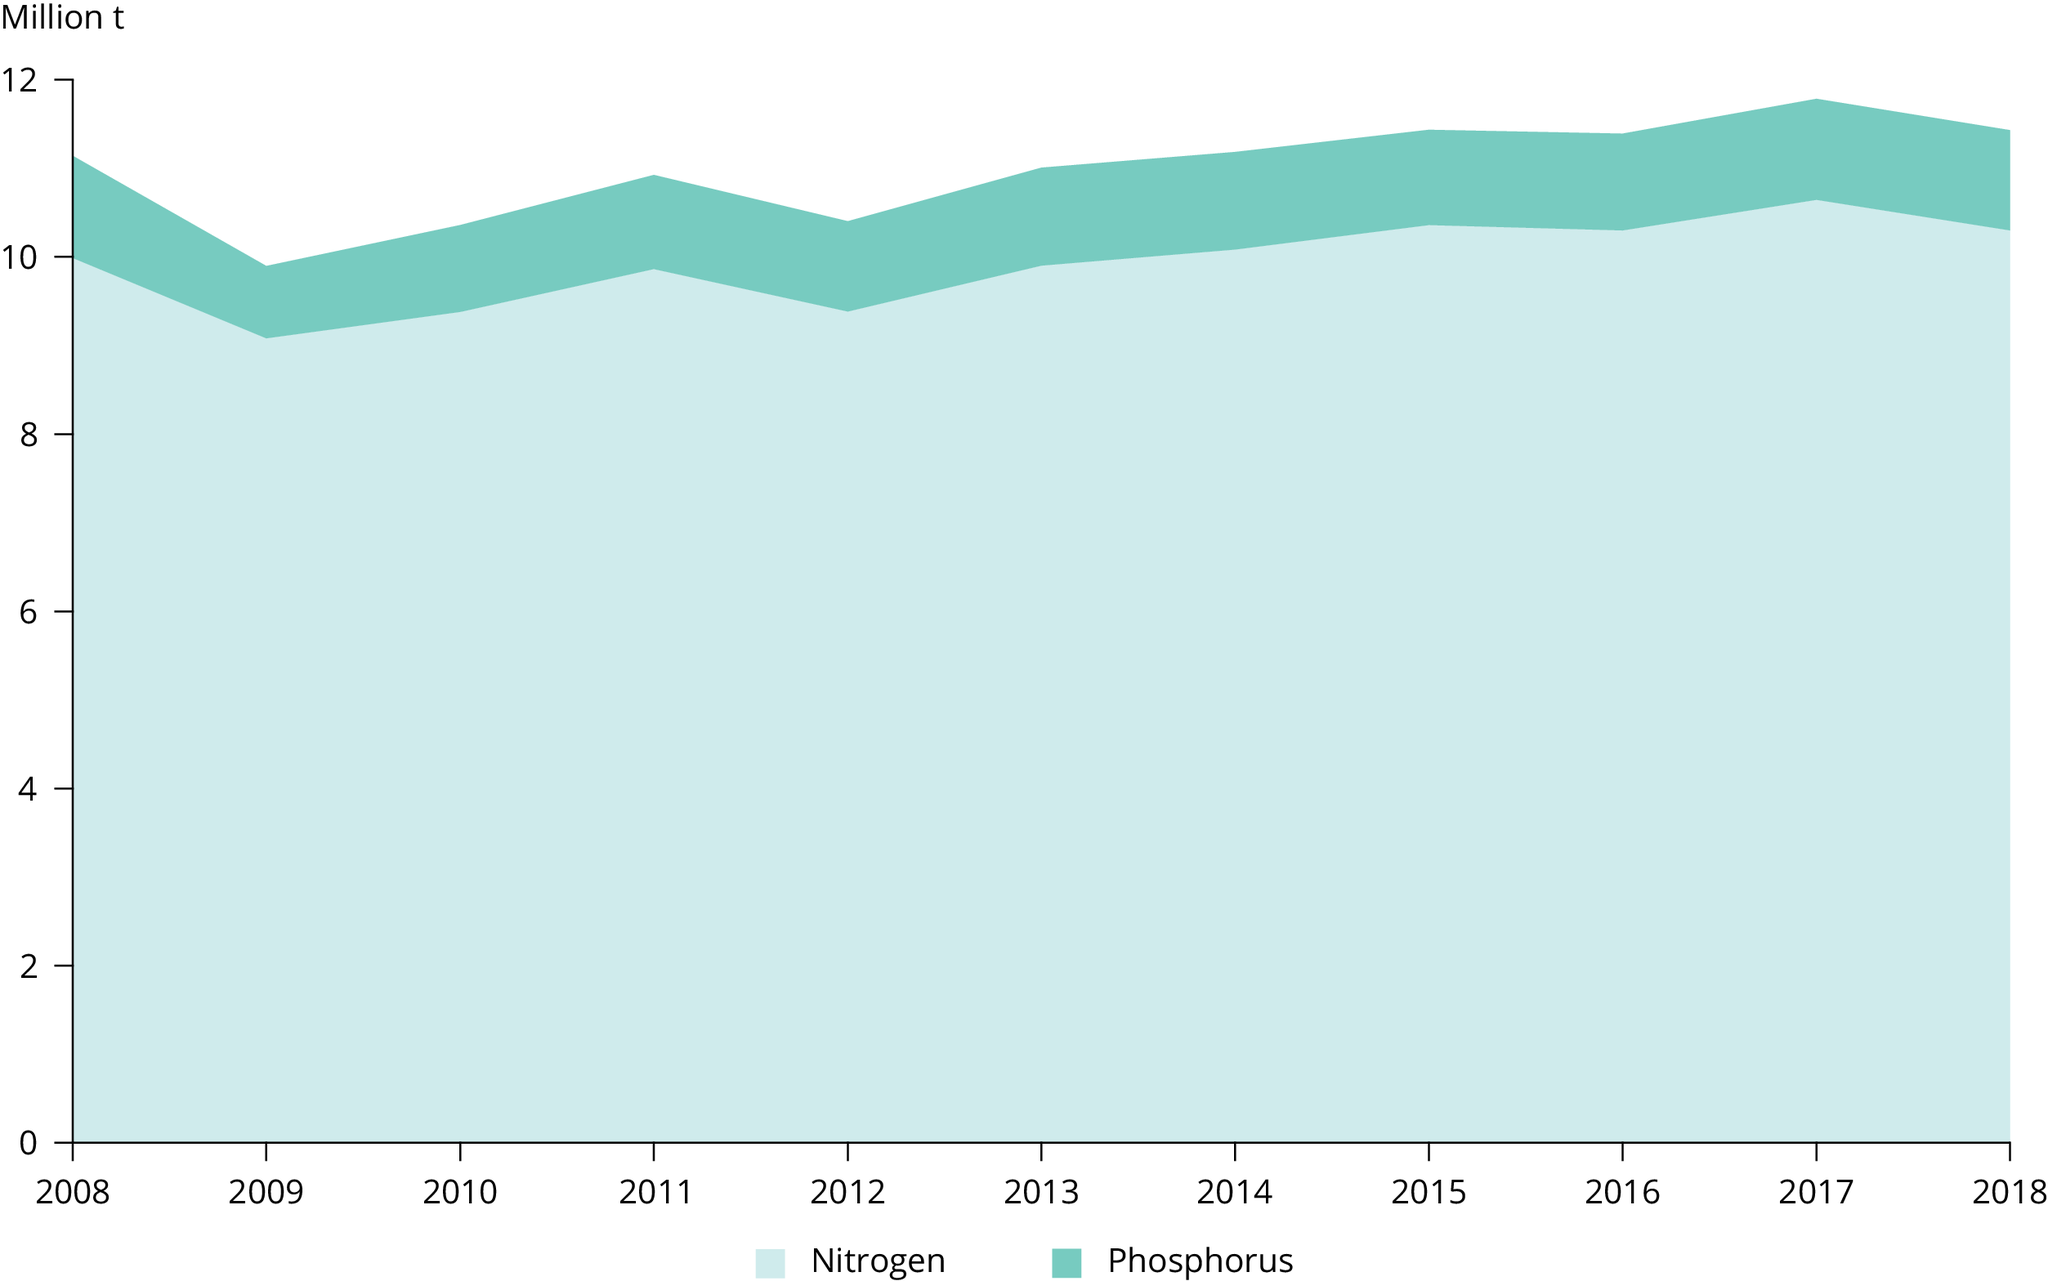
Source: Eurostat (2022c).
Click here for different chart formats and data
- Data from Eurostat (2021b) indicate that the EU’s livestock populations have remained relatively stable or have slightly decreased since 2010 (with the exception of pig numbers, which have increased since 2010). Available data on nitrogen and phosphorus inputs resulting from manure application indicate a slight decrease in inputs from 2010 to 2016 (EC, 2019).
- ‘Gross nitrogen balance on agricultural land’ is a metric that represents the potential surplus of nitrogen on agricultural land. Available data indicate that this has remained stable between 2010 and 2017 (the latest available year).
- The nitrogen use efficiency metric measures the amount of nitrogen recovered by a crop as a proportion of the nitrogen supplied to the crop (i.e. nitrogen already in the soil, and from manufactured fertiliser and manure applications). Currently, across the EU, it is estimated that nitrogen use efficiency is at 61% and would need to increase to 72%-74% to offer a reasonable level of protection to water bodies (de Vries and Schulte-Uebbing, 2020). While there are no trend data available on nitrogen use efficiency, the data that are available support the need for further measures.
The range of proxy indicators outlined above suggest that nutrient losses have remained relatively stable, with no indication of a significant reduction, over the last decade. Analysis of data from recent years will allow recently implemented policy measures and their impacts to be assessed.
Emissions from transport
Transport underpins much of Europe’s social and economic activity — connecting people with commodities, services and products. It remains a major source of pollution in Europe (and globally), although after sustained policy focus, air pollution from transport has significantly declined. Between 1990 and 2020:
- emissions of both carbon monoxide and non-methane volatile organic compounds (NMVOCs) fell by around 90%,
- emissions of sulphur oxides fell by 77%, and
- emissions of nitrogen oxides fell by 53%.
Between 2000-2020, transport emissions of fine particulate matter fell by 55%, and emissions of coarse particulate matter fell by 49%.
However, these decreases relate to 2020 data and thus are impacted by the contraction in transport volumes due to COVID-19; for example, in 2019, the reduction for NOX (from 1990) was 41%.
Air pollutant emissions have decreased for most transport modes since 1990. The exceptions are shipping, for which NOX emissions have increased, and aviation, for which emissions of all pollutants (except NMVOCs) have increased in line with the sector’s growth. Further data on shipping are presented in the zero pollution ‘Signal’ on shipping emissions. 2020 data for these sectors was also influenced by COVID-19.
Source: EEA, 2022c
Monitoring the use and risk of chemical pesticides
Inappropriate pesticide use can also lead to harmful impacts. Although pesticides help support food production, they are designed to be potent, toxic chemicals and carry a very high pollution risk. For example, the zero pollution ‘Signal’ on pesticides and pollinators illustrates how bees can be impacted by pesticides, while pesticides residues in foods can impact on health, as explained in the health and chemicals assessment. The European Commission has developed a set of risk indicators on chemical pesticides to track progress towards the zero pollution and farm to fork targets for pesticide reduction. These indicators show that the risk and use of pesticides has decreased by 14% since the baseline period of 2015-2017 (Figure 12) (EC, 2022). The indicators also show that the use of more hazardous pesticides has decreased by 26% since the baseline period of 2015-2017 (not shown in Figure 12).
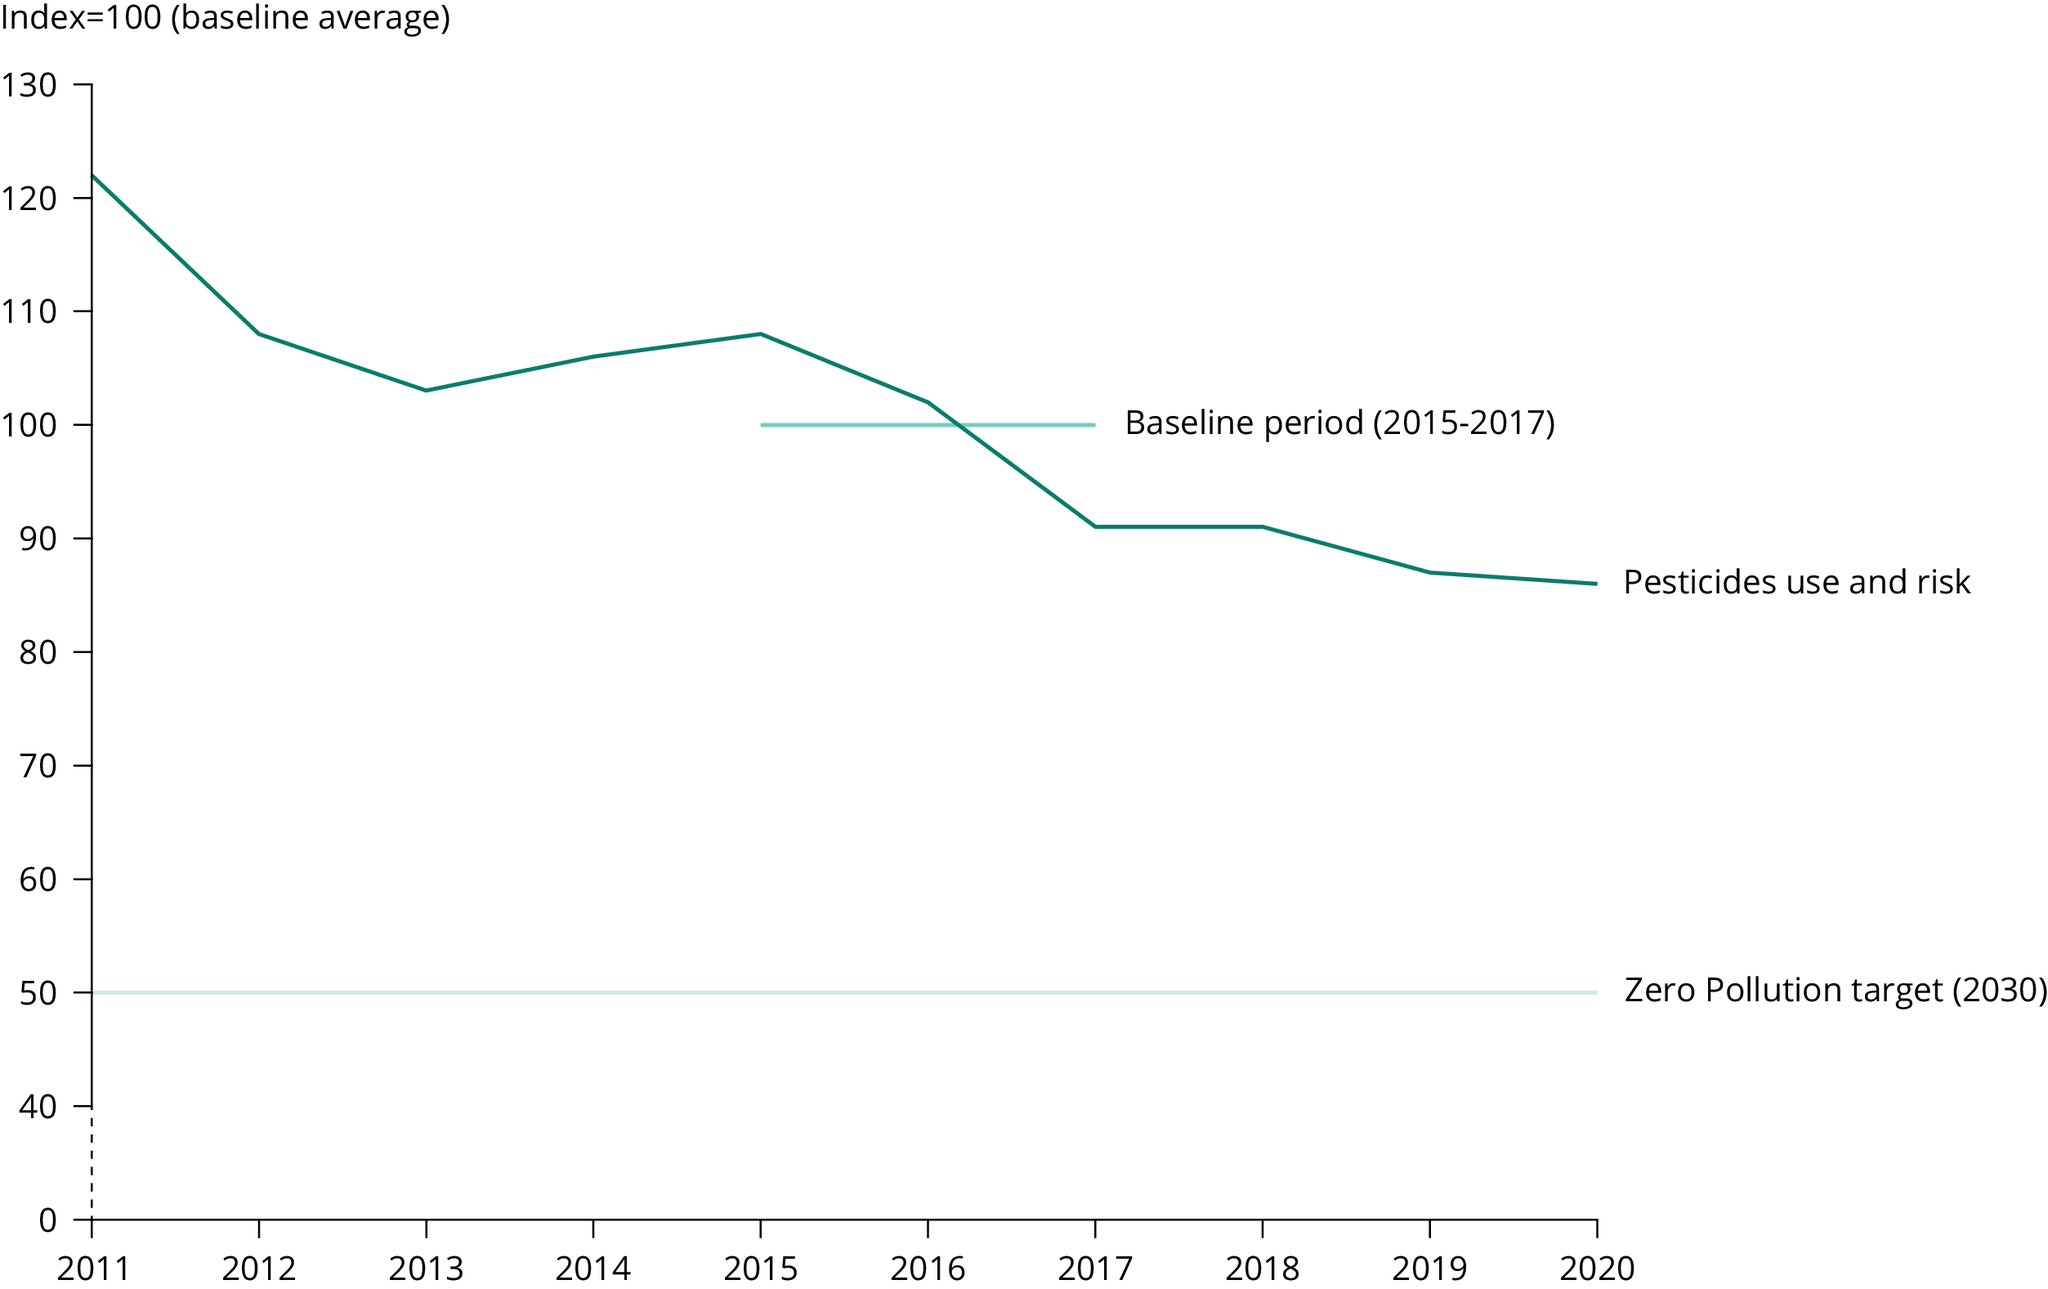
Source: EC (2022).
Click here for different chart formats and data
By producing food using natural substances and processes, organic farming offers an opportunity to reduce the environmental impact of agriculture. However, risks still exist in relation to the use of copper-based pesticides; this is because copper becomes toxic above certain thresholds, as explained in the zero pollution ecosystems and soil assessment. Organic produce also remains relatively expensive, which limits its diffusion into mainstream consumer markets. According to Eurostat (2022b), the organic farming area in Europe continues to increase. In 2020, organic farming covered 9.1% of agricultural land in the EU, compared with 5.9% in 2012.
Note: Links to Indicators: Industrial pollutant releases to air in Europe, Industrial pollutant releases to water in Europe, Trends in the use and risk of chemical pesticides and more hazardous pesticides, Organic farming statistics, Emissions of air pollutants from transport.
Overview of indicator analysis methodology
This indicator analysis is in line with the approach taken by the EEA for its seventh environment action programme monitoring.
Past trends are based on assessment of the trend over the last 10 years (or since the relevant zero pollution baseline year where appropriate) with green, yellow or red being applied based on the criteria as outlined in the figure legend. Expert judgement is also applied, for example in cases where indicators are more qualitative and/or uncertain.
The distance to target is based on an assessment of the recent trend, current status and expert judgement.
Further detailed analysis of the future outlook for meeting certain zero pollution targets is included in the zero pollution outlook 2022, completed by the European Commission Joint Research Centre (JRC, 2022).
References
Caldeira, C., et al., 2022, Safe and sustainable by design chemicals and materials: review of safety and sustainability dimensions, aspects, methods, indicators, and tools, JRC Technical Report JRC127109, Publications Office of the European Union, Luxembourg (https://publications.jrc.ec.europa.eu/repository/handle/JRC127109) accessed 10 October 2022.
de Vries, W. and Schulte-Uebbing, L., 2020, Required changes in nitrogen inputs and nitrogen use efficiencies to reconcile agricultural productivity with water and air quality objectives in the EU-27, paper presented to the International Fertiliser Society, Cambridge, UK, 12 December 2019, Proceedings 842 (https://www.fertilizerseurope.com/wp-content/uploads/2020/03/Proc-842-de-Vries-short-abstract_-21-Feb.pdf) accessed 10 October 2022.
EC, 2019, ‘Fertilisers in the EU – prices, trade and use’, EU agricultural market brief no. 15, European Commission (https://ec.europa.eu/info/sites/default/files/food-farming-fisheries/farming/documents/market-brief-fertilisers_june2019_en.pdf) accessed 8 November 2022.
EC, 2022, ‘Trends in the use and risk of chemical pesticides and the use of more hazardous pesticides’, EU: Trends, European Commission (https://food.ec.europa.eu/plants/pesticides/sustainable-use-pesticides/farm-fork-targets-progress/eu-trends_en) accessed 10 October 2022.
EEA, 2021c, ‘Air pollutant emissions data viewer (Gothenburg Protocol, LRTAP Convention) 1990-2020’, European Environment Agency (https://www.eea.europa.eu/data-and-maps/dashboards/air-pollutant-emissions-data-viewer-4) accessed 27 April 2022.
EEA, 2022a, ‘Industrial pollutant releases to air in Europe’, European Environment Agency (https://www.eea.europa.eu/ims/industrial-pollutant-releases-to-air) accessed 10 October 2022.
EEA, 2022b, ‘Industrial pollutant releases to water in Europe’, European Environment Agency (https://www.eea.europa.eu/ims/industrial-pollutant-releases-to-water) accessed 10 October 2022.
EEA, 2022c, ‘Emissions of air pollutants from transport in Europe’, European Environment Agency (https://www.eea.europa.eu/ims/emissions-of-air-pollutants-from) accessed 20 November 2022.
Eurofound, 2019, The future of manufacturing in Europe, Publications Office of the European Union, Luxembourg (https://www.eurofound.europa.eu/sites/default/files/ef_publication/field_ef_document/fomeef18002en.pdf) accessed 10 October 2022.
Eurostat, 2021a, ‘Chemicals production and consumption statistics’, Eurostat Statistics Explained (https://ec.europa.eu/eurostat/statistics-explained/index.php?title=Chemicals_production_and_consumption_statistics#Total_consumption_of_chemicals) accessed 27 October 2022.
Eurostat, 2021b, ‘Agricultural production — livestock and meat’, Eurostat Statistics Explained (https://ec.europa.eu/eurostat/statistics-explained/index.php?title=Agricultural_production_-_livestock_and_meat&oldid=427096#Livestock_population) accessed 10 October 2022.
Eurostat, 2022a, ‘Production and consumption of chemicals by hazard class’, ENV_CHMHAZ, Eurostat Data Browser (https://ec.europa.eu/eurostat/databrowser/view/env_chmhaz/default/table?lang=en) accessed 10 October.
Eurostat, 2022b, ‘Organic farming statistics’, Eurostat Statistics Explained (https://ec.europa.eu/eurostat/statistics-explained/index.php?title=Organic_farming_statistics) accessed 10 October 2022.
Eurostat, 2022c, ‘Agri-environmental indicator — mineral fertiliser consumption’, Eurostat Statistics Explained (https://ec.europa.eu/eurostat/statistics-explained/index.php?title=Agri-environmental_indicator_-_mineral_fertiliser_consumption) accessed 10 October 2022.
JRC, 2022, Zero pollution outlook 2022, JRC129655, Publications Office of the European Union, Luxembourg, Joint Research Centre (https://joint-research-centre.ec.europa.eu/zero-pollution-outlook-2022_en) accessed 1 December 2022.
Van Liedekerke, M. et al., 2013, ‘Progress in the Management of Contaminated Sites in Europe’, Publications Office of the European Union (https://publications.jrc.ec.europa.eu/repository/handle/JRC85913) accessed 27 October 2022.
Cover image source: © Mateo Puđa, Well with Nature /EEA

Document Actions
Share with others