LULUCF sector reporting obligations
The EU and its Member States, as parties to the United Nations Framework Convention on Climate change (UNFCCC), shall compile annual national greenhouse gas (GHG) inventories[1]. The EU GHG inventory, which is based on the aggregation of the EU Member States’ own inventories reported to the UNFCCC, includes anthropogenic emissions and removals of GHGs. It also includes a wealth of information on the status of and trends in soil carbon pools (see Box 1). When estimating GHG emissions and removals, Member States have to follow IPCC guidelines. EU and Member States’ GHG emissions are internally and externally reviewed annually by experts, following internationally agreed review guidelines.
A greenhouse gas inventory for land use includes emissions and removals of greenhouse gases due to changes in carbon pools. This includes carbon stored in living biomass (above and below ground), dead wood, litter and soils.
Managed land: Managed land is land where human interventions and practices have been applied to perform production, ecological or social functions. Countries should apply this definition consistently over time (IPCC, 2006). The ultimate objective of the United Nations Framework Convention on Climate Change and its Paris Agreement is to prevent dangerous anthropogenic interference with the climate system. To separate anthropogenic from non-anthropogenic in the land use, land use change and forestry sector, countries follow the guidelines provided by the Intergovernmental Panel on Climate Change (IPCC). The IPCC considers emissions and removals from managed land to be because of human activities and thus anthropogenic and those from unmanaged land to be non-anthropogenic. Only anthropogenic emissions and removals are reported in the greenhouse gas inventories (IPCC, 2006).
Soil types: Organic soil has a high concentration of organic matter. Soils are organic if they satisfy requirements 1 and 2 such as a land area under cultivation, or 1 and 3 such as a wetland area:
- The soil must have a depth of 10cm or more. A horizon less than 20cm deep must contain 12% or more organic carbon when mixed to a depth of 20cm.
- The soil is never saturated with water for more than a few days and must contain more than 20% (by weight) organic carbon (about 35% organic matter).
- The soil must be subject to periods when it is saturated with water and have:
- at least 12% (by weight) organic carbon (about 20% organic matter) if it has no clay; or
- at least 18% (by weight) organic carbon (about 30% organic matter) if it has 60% or more clay; or
- an intermediate, proportional amount of organic carbon for intermediate amounts of clay (IPCC, 2006).
Mineral soils: Every other soil that is not an organic soil is classified as a mineral soil.
The GHG inventory covers the land use, land use change and forestry (LULUCF) sector, which is the only sector in the inventory that includes both emissions and removals of GHGs. Reporting requirements are structured in accordance with Intergovernmental Panel on Climate Change (IPCC) guidelines. They include six land use categories: forest land, cropland, grassland, wetlands, settlements and other land (IPCC, 2006). Each land use category includes two soil categories — mineral soil and organic soil. Organic soil has a high carbon content (see box 1).
Soils in the 2019 LULUCF sector inventories
The EU LULUCF sector is a significant sink, meaning that it removes CO2 from the atmosphere by storing more carbon on land. However, there are large differences in carbon storage capacity between countries because of the size of the country, the dominant land use categories and the soil types in each country. Member States report GHG fluxes, which are gains and losses of carbon due to human activities. To distinguish anthropogenic from non-anthropogenic fluxes, Member States classify their land as managed or unmanaged, respectively (see Box 1). Most of the land in the EU is managed. However, this is less the case for the wetland category, which also happens to have relatively more land with organic soil than the other land use categories. Because the GHG inventories include only anthropogenic emissions and removals, fluxes in unmanaged land are not reported in the national GHG inventories.
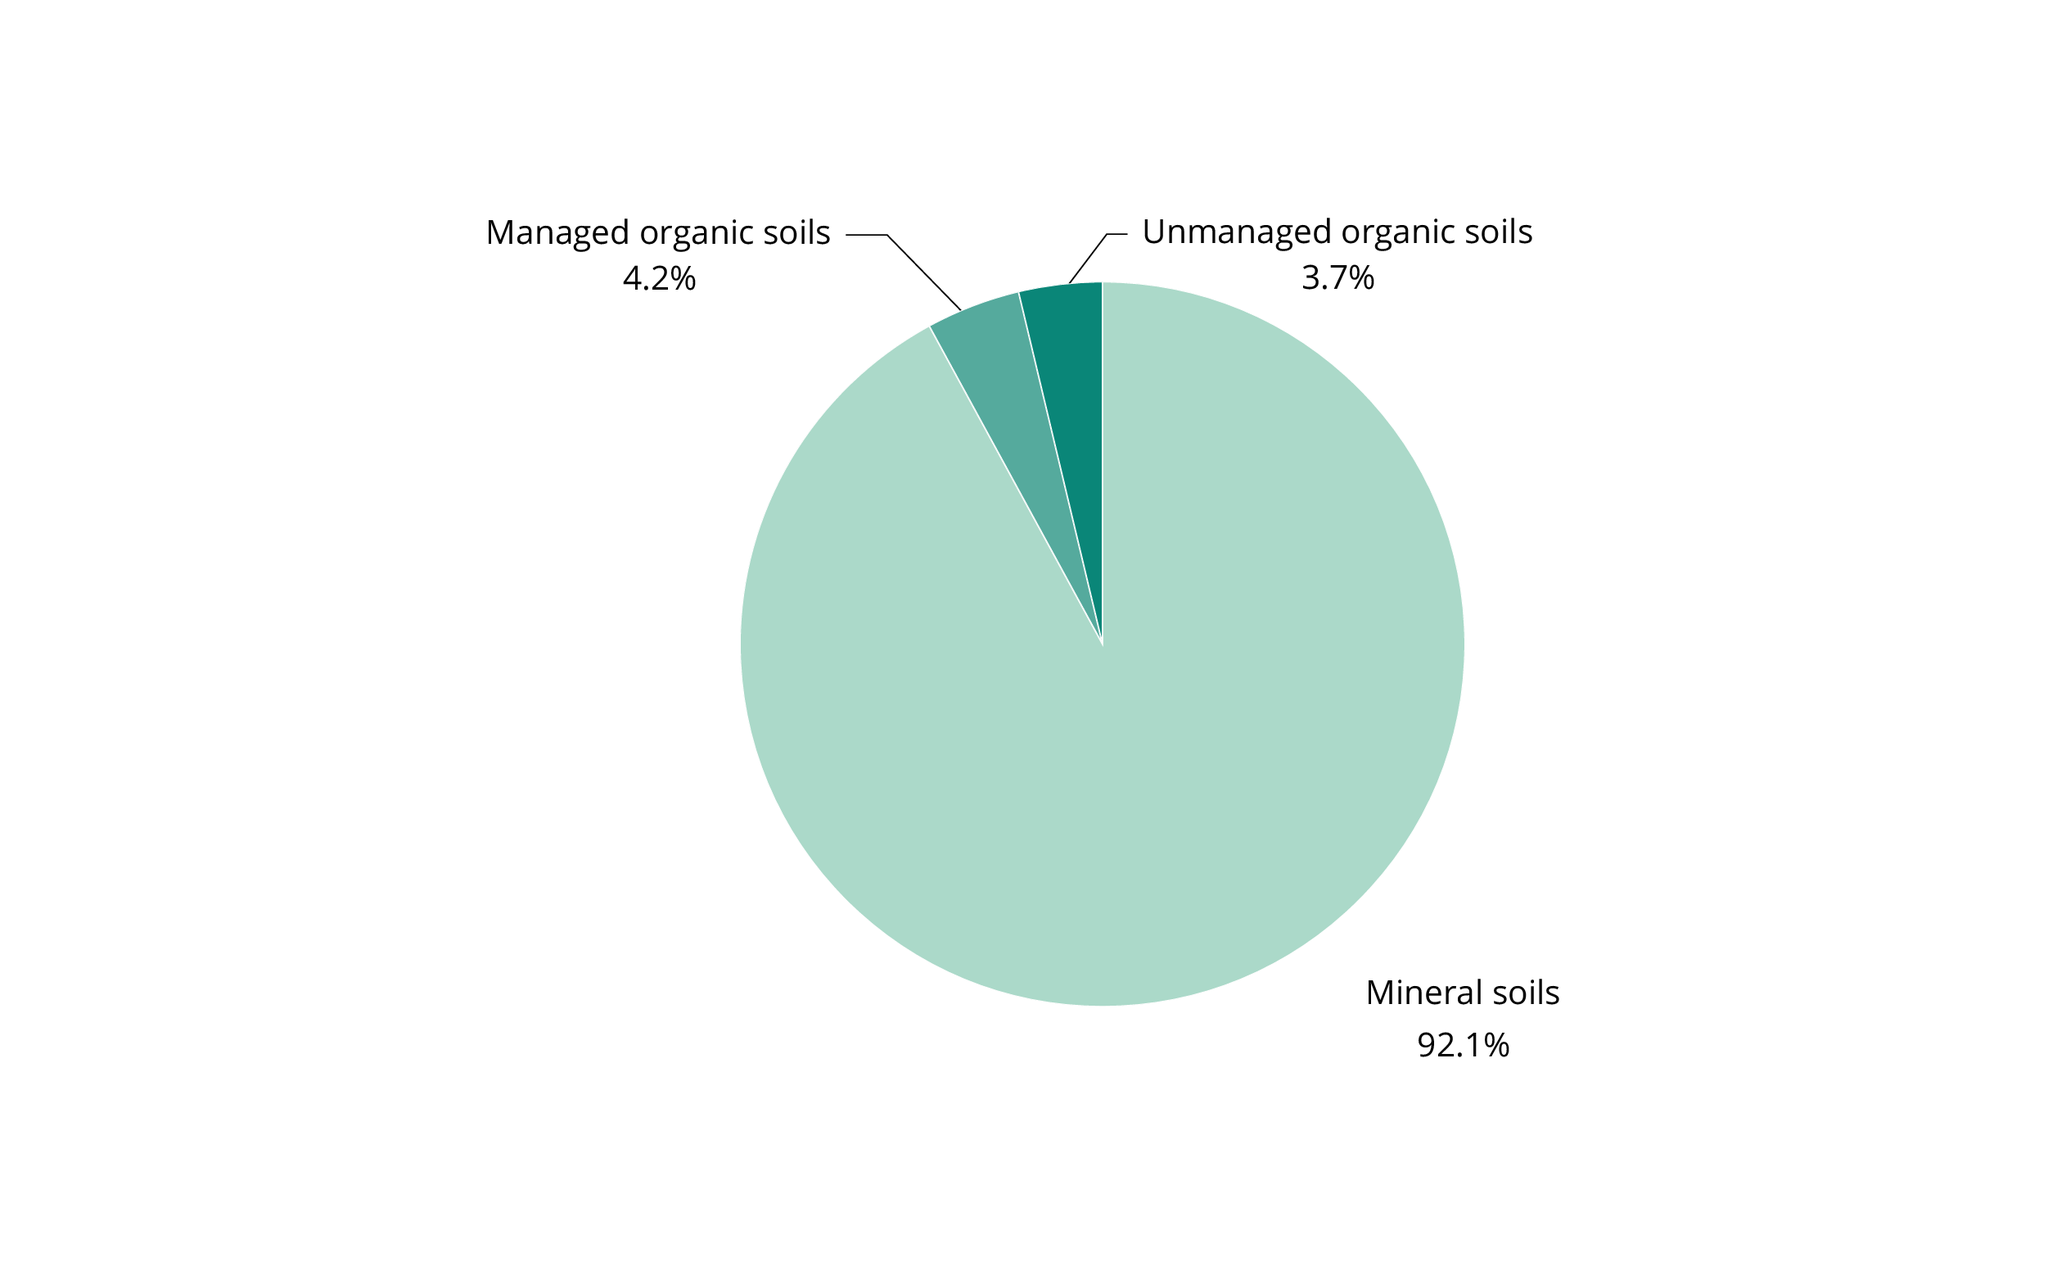
According to the EU GHG inventory for the year 2019, 92.1% of the land area reported in all six land use categories comprises mineral soil and 7.9% of the land area comprises organic soils. However, only slightly more than half of the area with organic soil is classified as managed (see Figure 1). All of the unmanaged organic soil is reported in the wetlands category. Approximately 1% of the area with mineral soil is unmanaged.
Click here for different chart formats and data
Click here for different chart formats and data
Six Member States report not having any organic soils, and in many other Member States the area of organic soil is small. Organic soils occur mainly in northern Europe, where the colder and wetter climate favours the build-up of carbon in soil. The total area of organic soils reported by Member States is over 33 million hectares, of which 74% are found in Finland and Sweden. Of the area with organic soils, 15.7 million hectares are unmanaged and belong to the wetland category. These are also mostly located in Finland and Sweden.
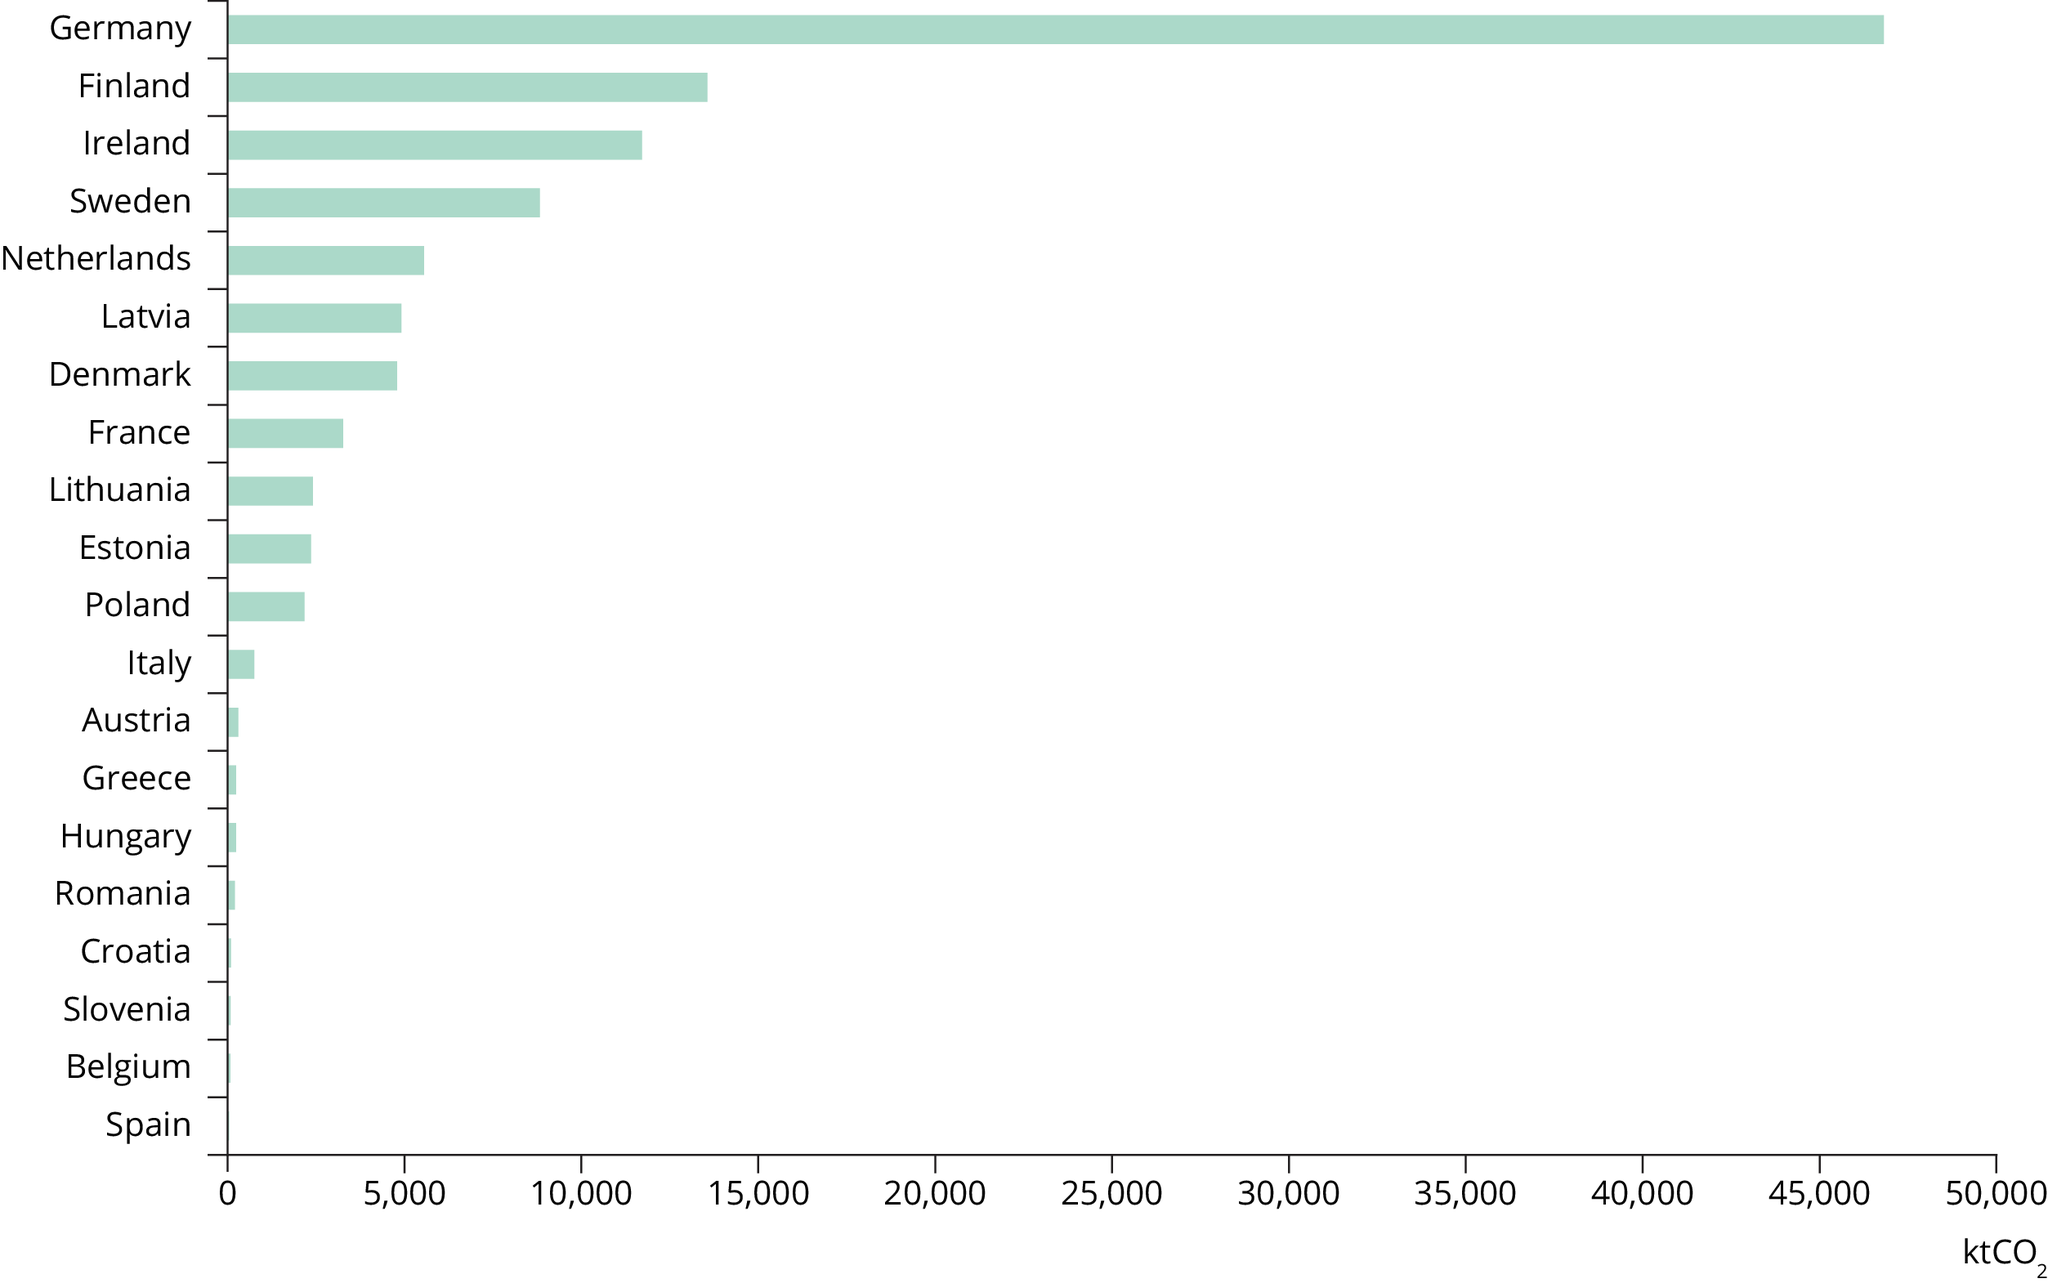
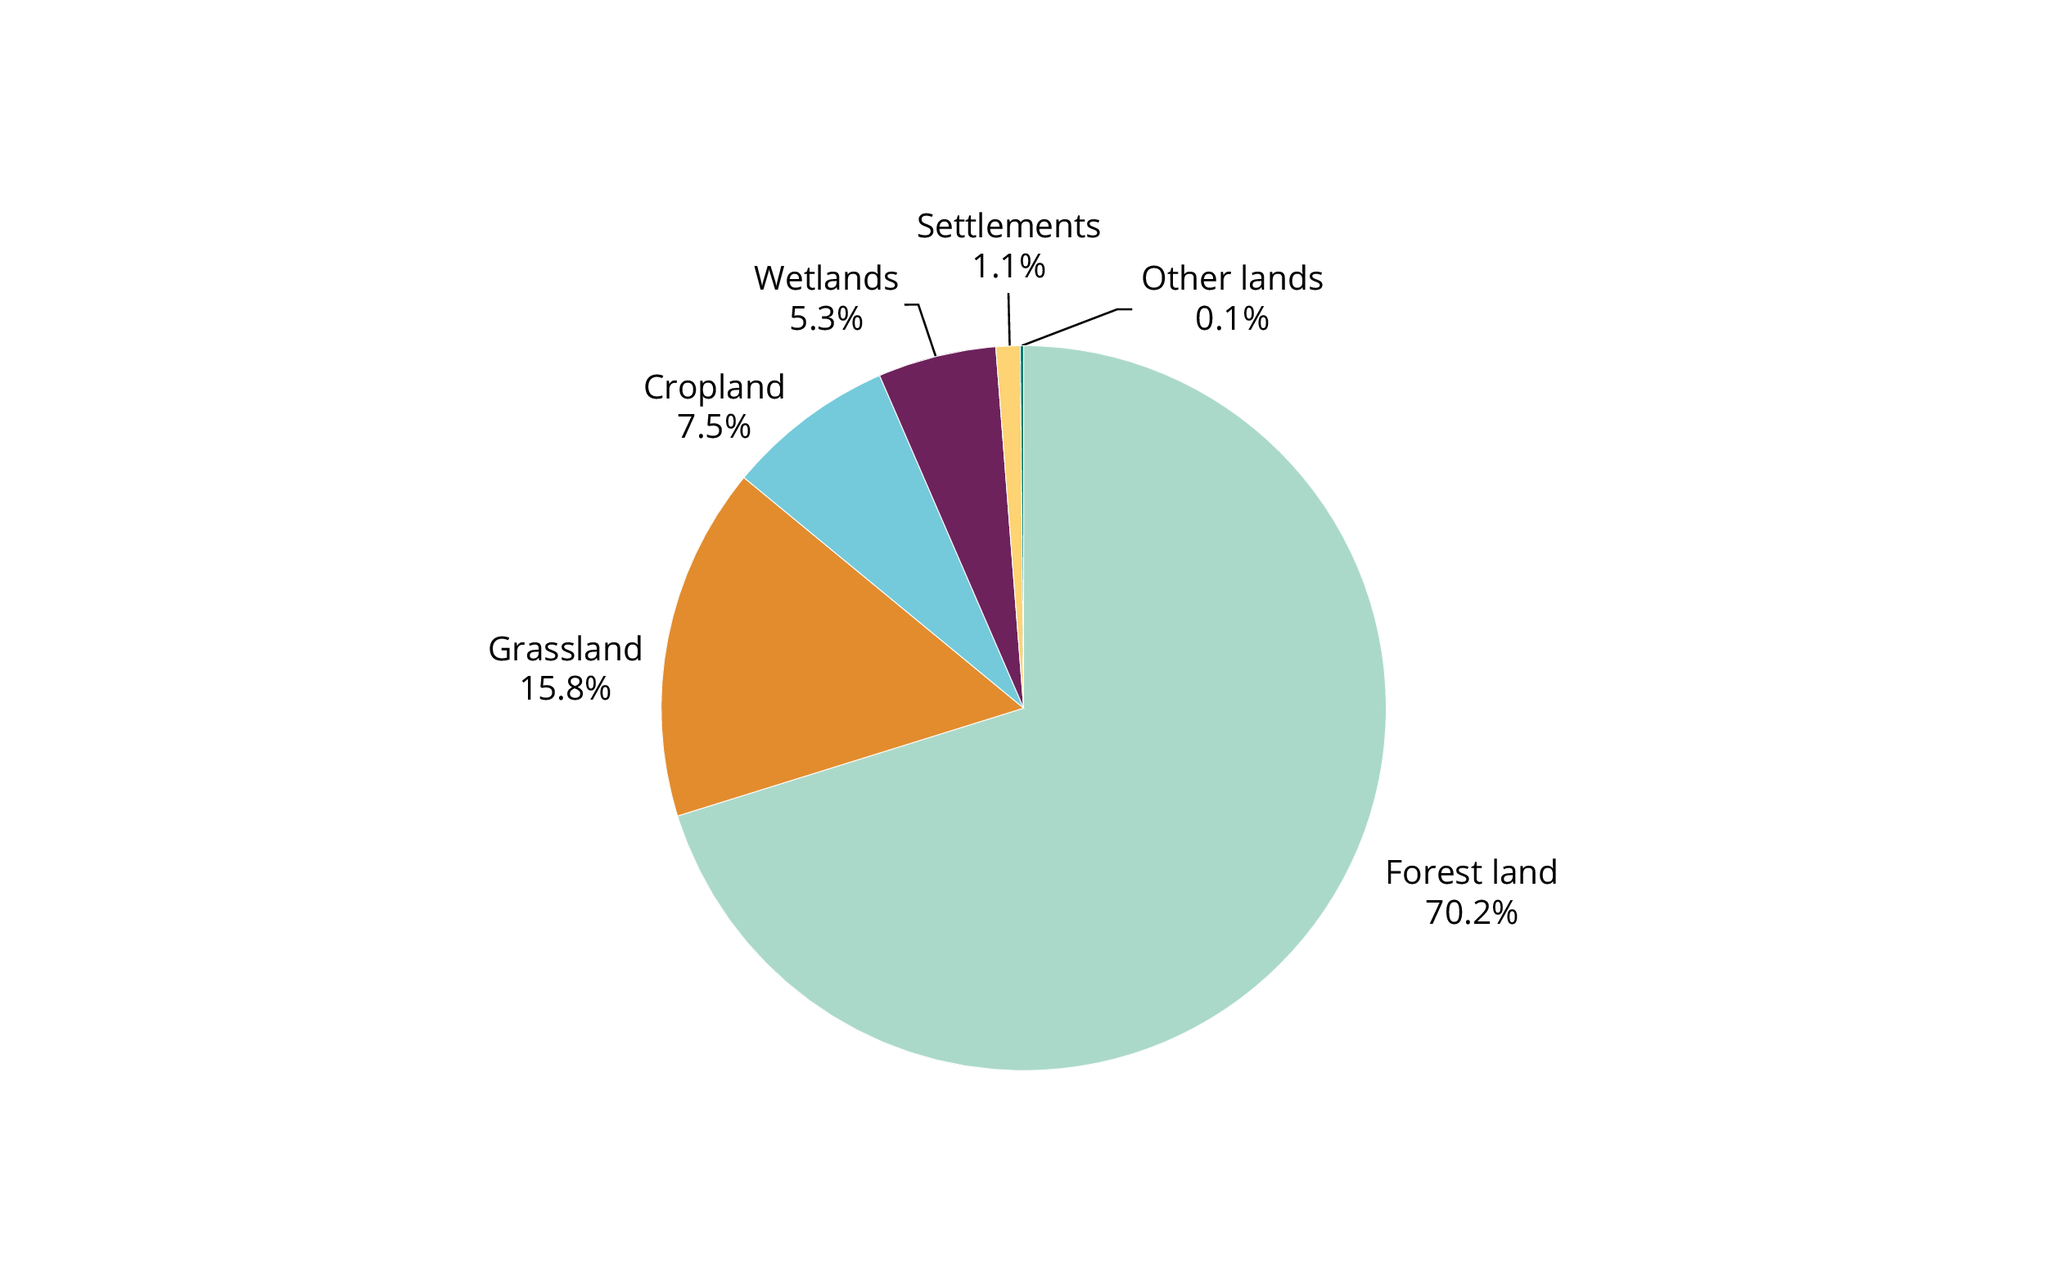
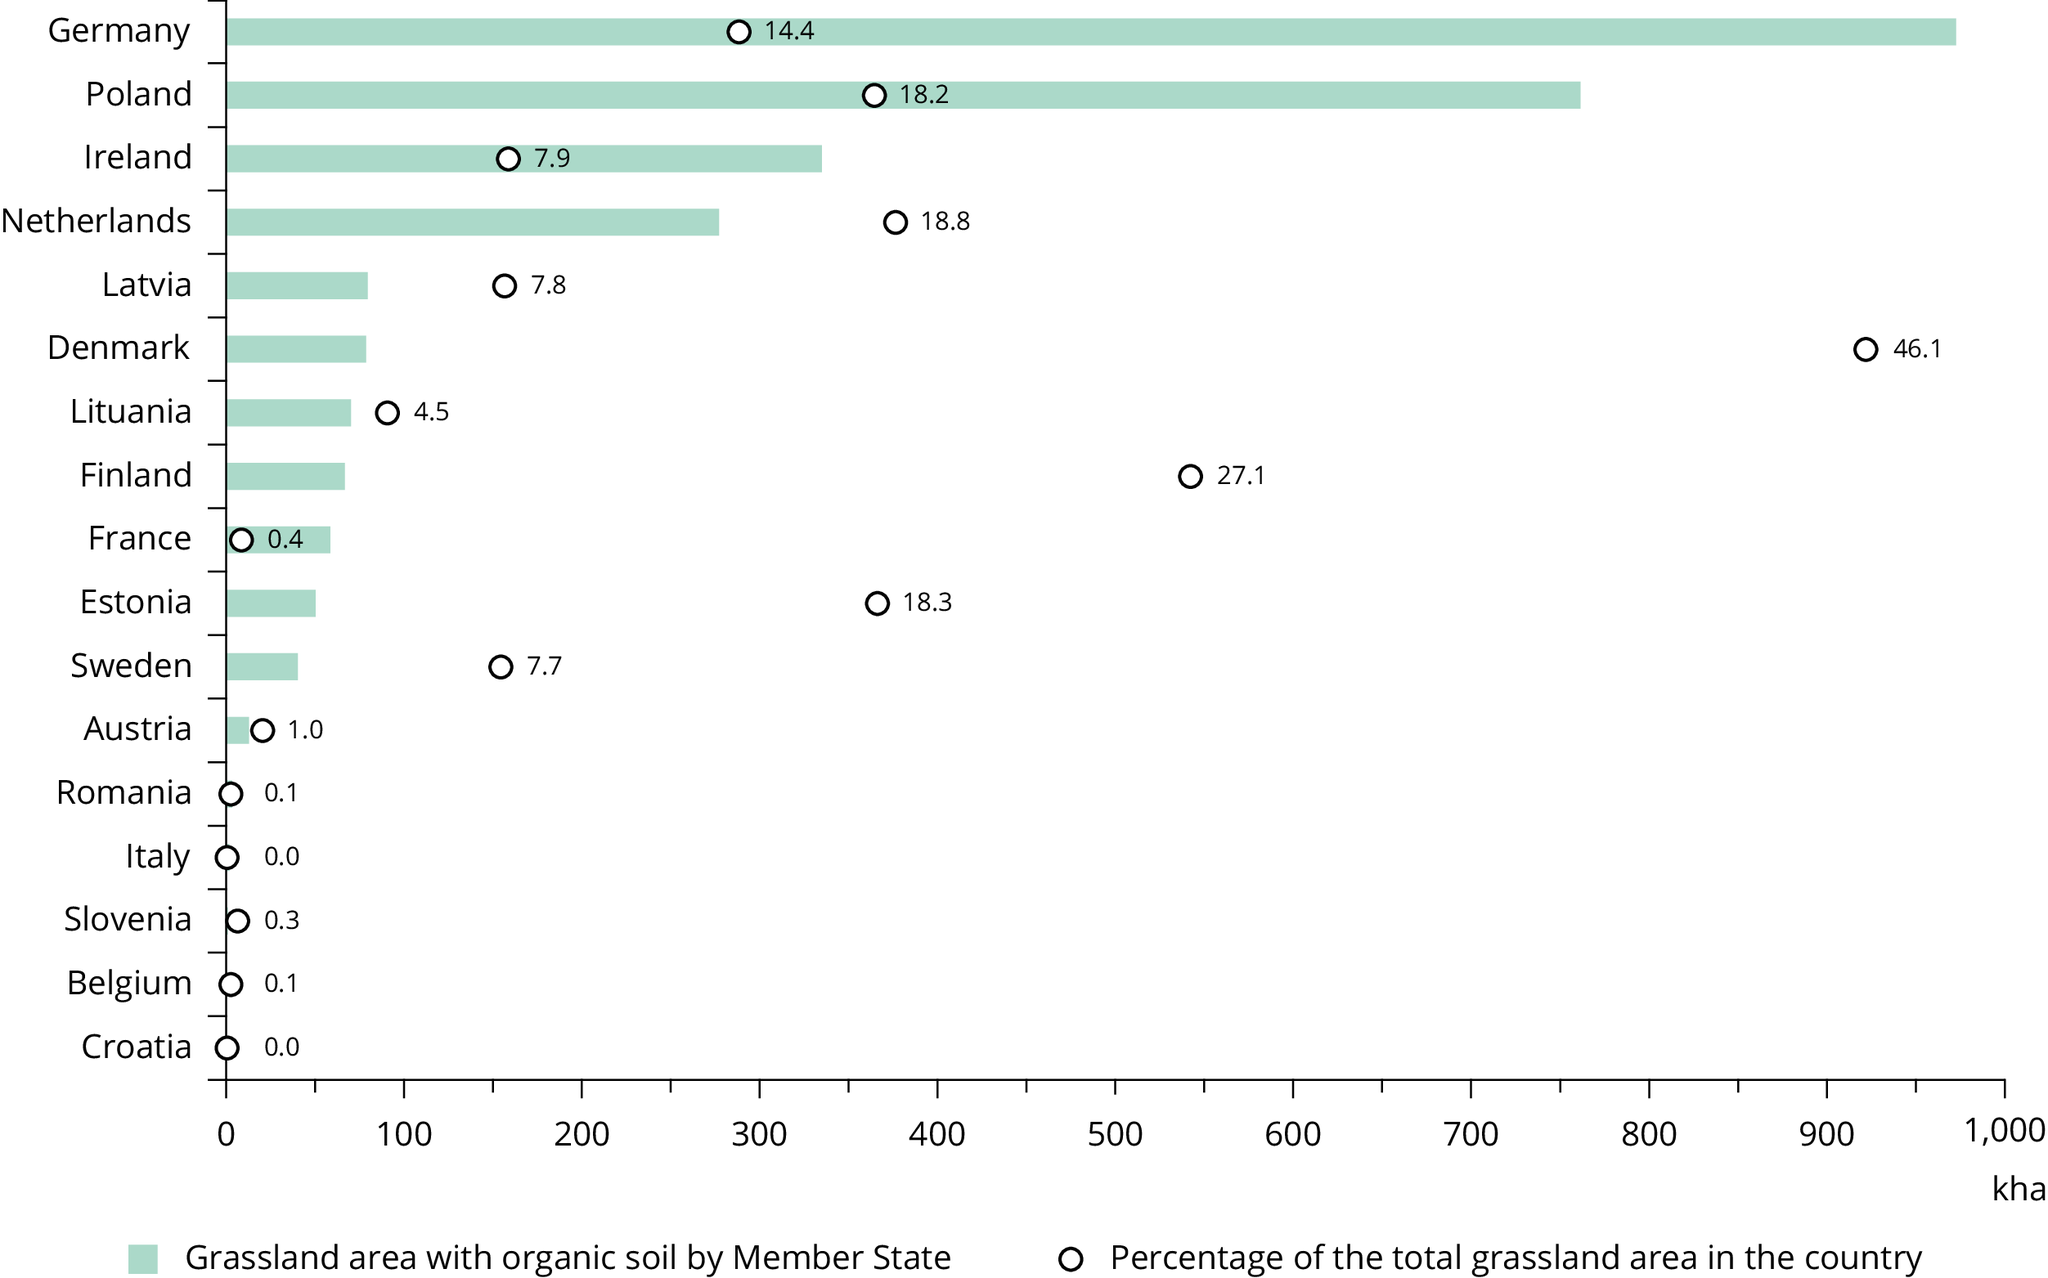
The area of managed organic soils is not distributed evenly by land use category (see Figure 2), which has implications for the GHG fluxes. The cropland and grassland categories generally have higher GHG emissions per hectare than other land use categories, with the exception of peat extraction. For the cropland category, the biggest areas of managed organic soils are in Germany, Finland, Poland and Sweden (see Figure 3). In grasslands, the largest areas of organic soils are found in Germany, Poland, Ireland and the Netherlands (see Figure 4).
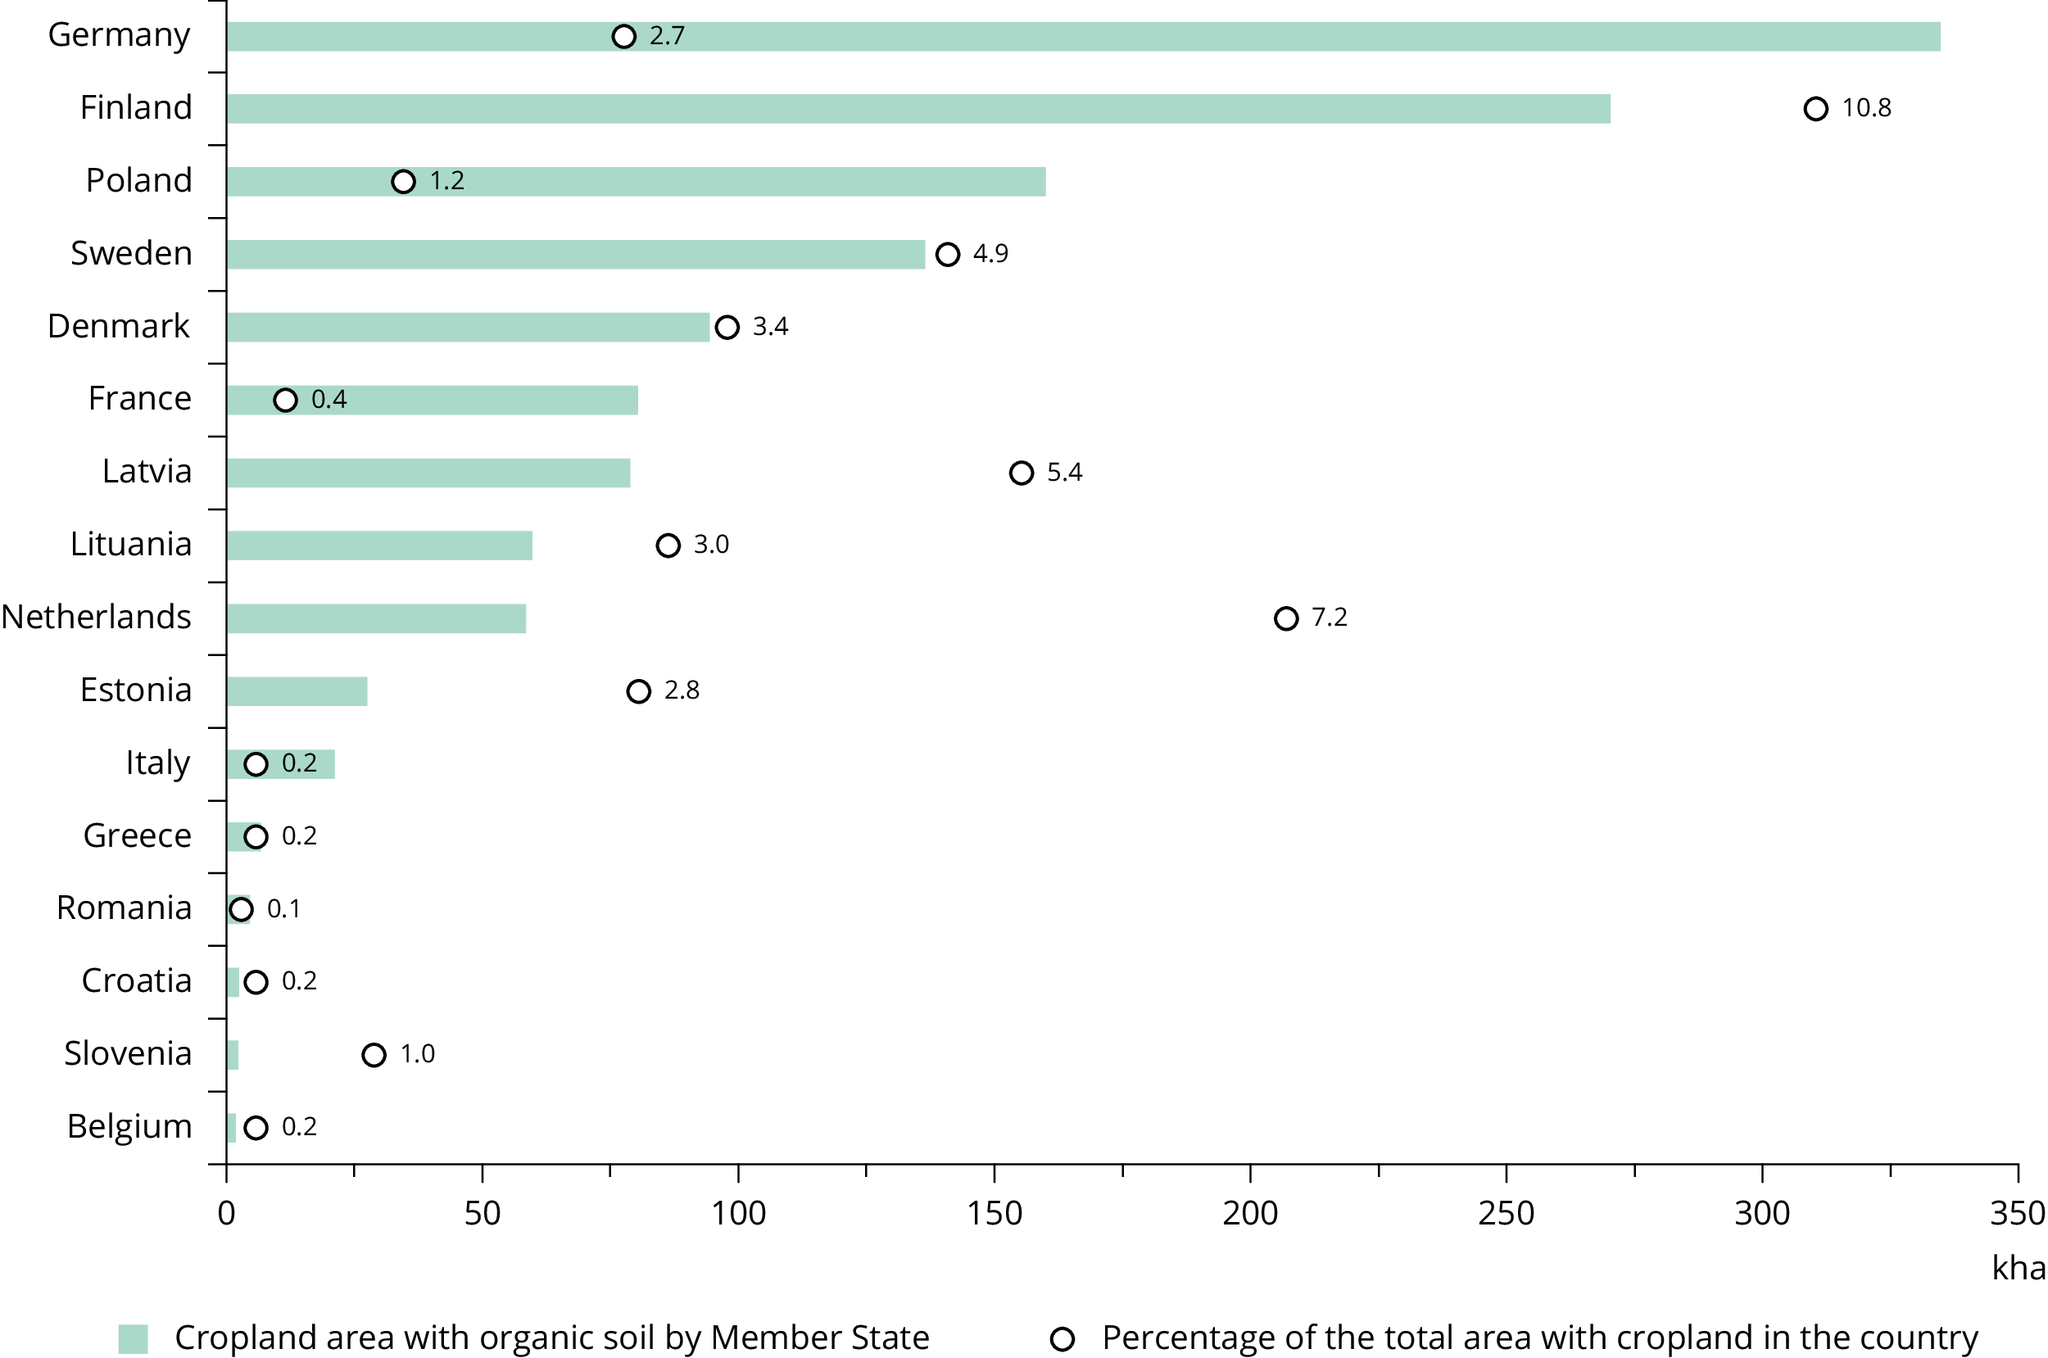
Note: 16 EU Member States reported organic soils in this land use category.
Click here for different chart formats and data
Peat extraction
Eleven Member States report on peat extraction, but some have only a small area. Peat extraction is part of the wetlands land use category. In total it covers 286.8kha in the EU, with the largest areas found in Finland, Ireland, Latvia, Estonia and Germany. The carbon loss per hectare varies between Member States, but this type of land use has the highest carbon loss per hectare. In total, Member States reported a loss due to peat extraction of 2.3Mt carbon per year, corresponding to emissions of 8.3Mt CO2.
Greenhouse gas emissions and removals
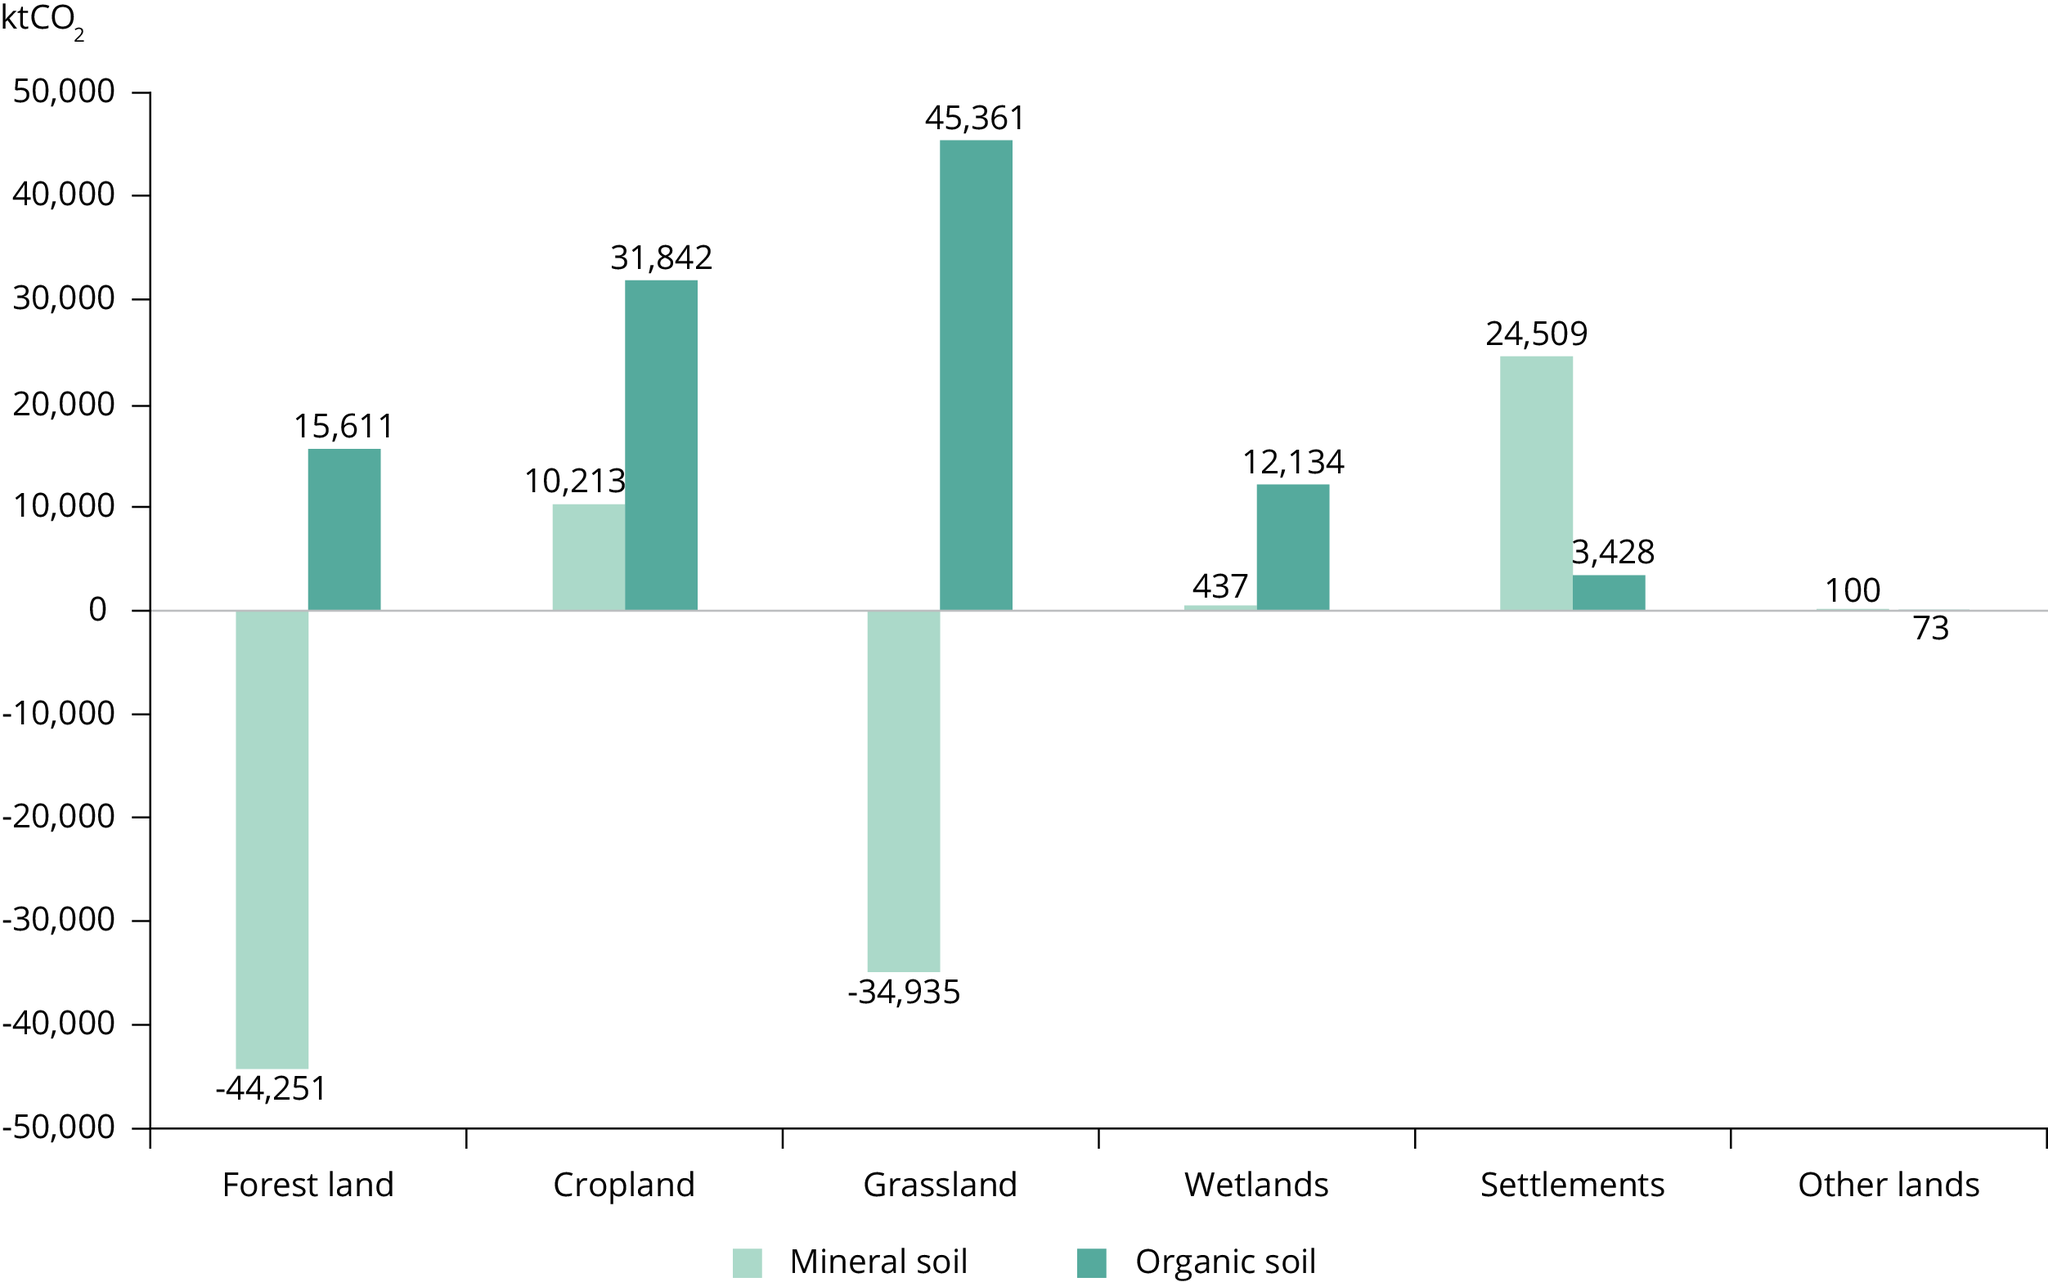
Note: Emissions are positive numbers and removals are negative numbers.
Click here for different chart formats and data
Overall, EU soils are losing carbon. In 2019, Member States reported net emissions of 108Mt CO2 from organic soil and net removals of 44Mt CO2 from mineral soil. The organic soils under cropland and grassland that are responsible for most of the emissions constitute 1.1% of the total area with cropland and 3.8% of the total area with grassland. (see Figure 5). The picture is, however, mixed depending on soil type and management practices; it is possible for the same type of land use to lose carbon in one Member State and increase carbon stocks in another. This is due to differences in management and, in particular, changes in management that have an impact on the gain and loss of carbon for several years after the change.
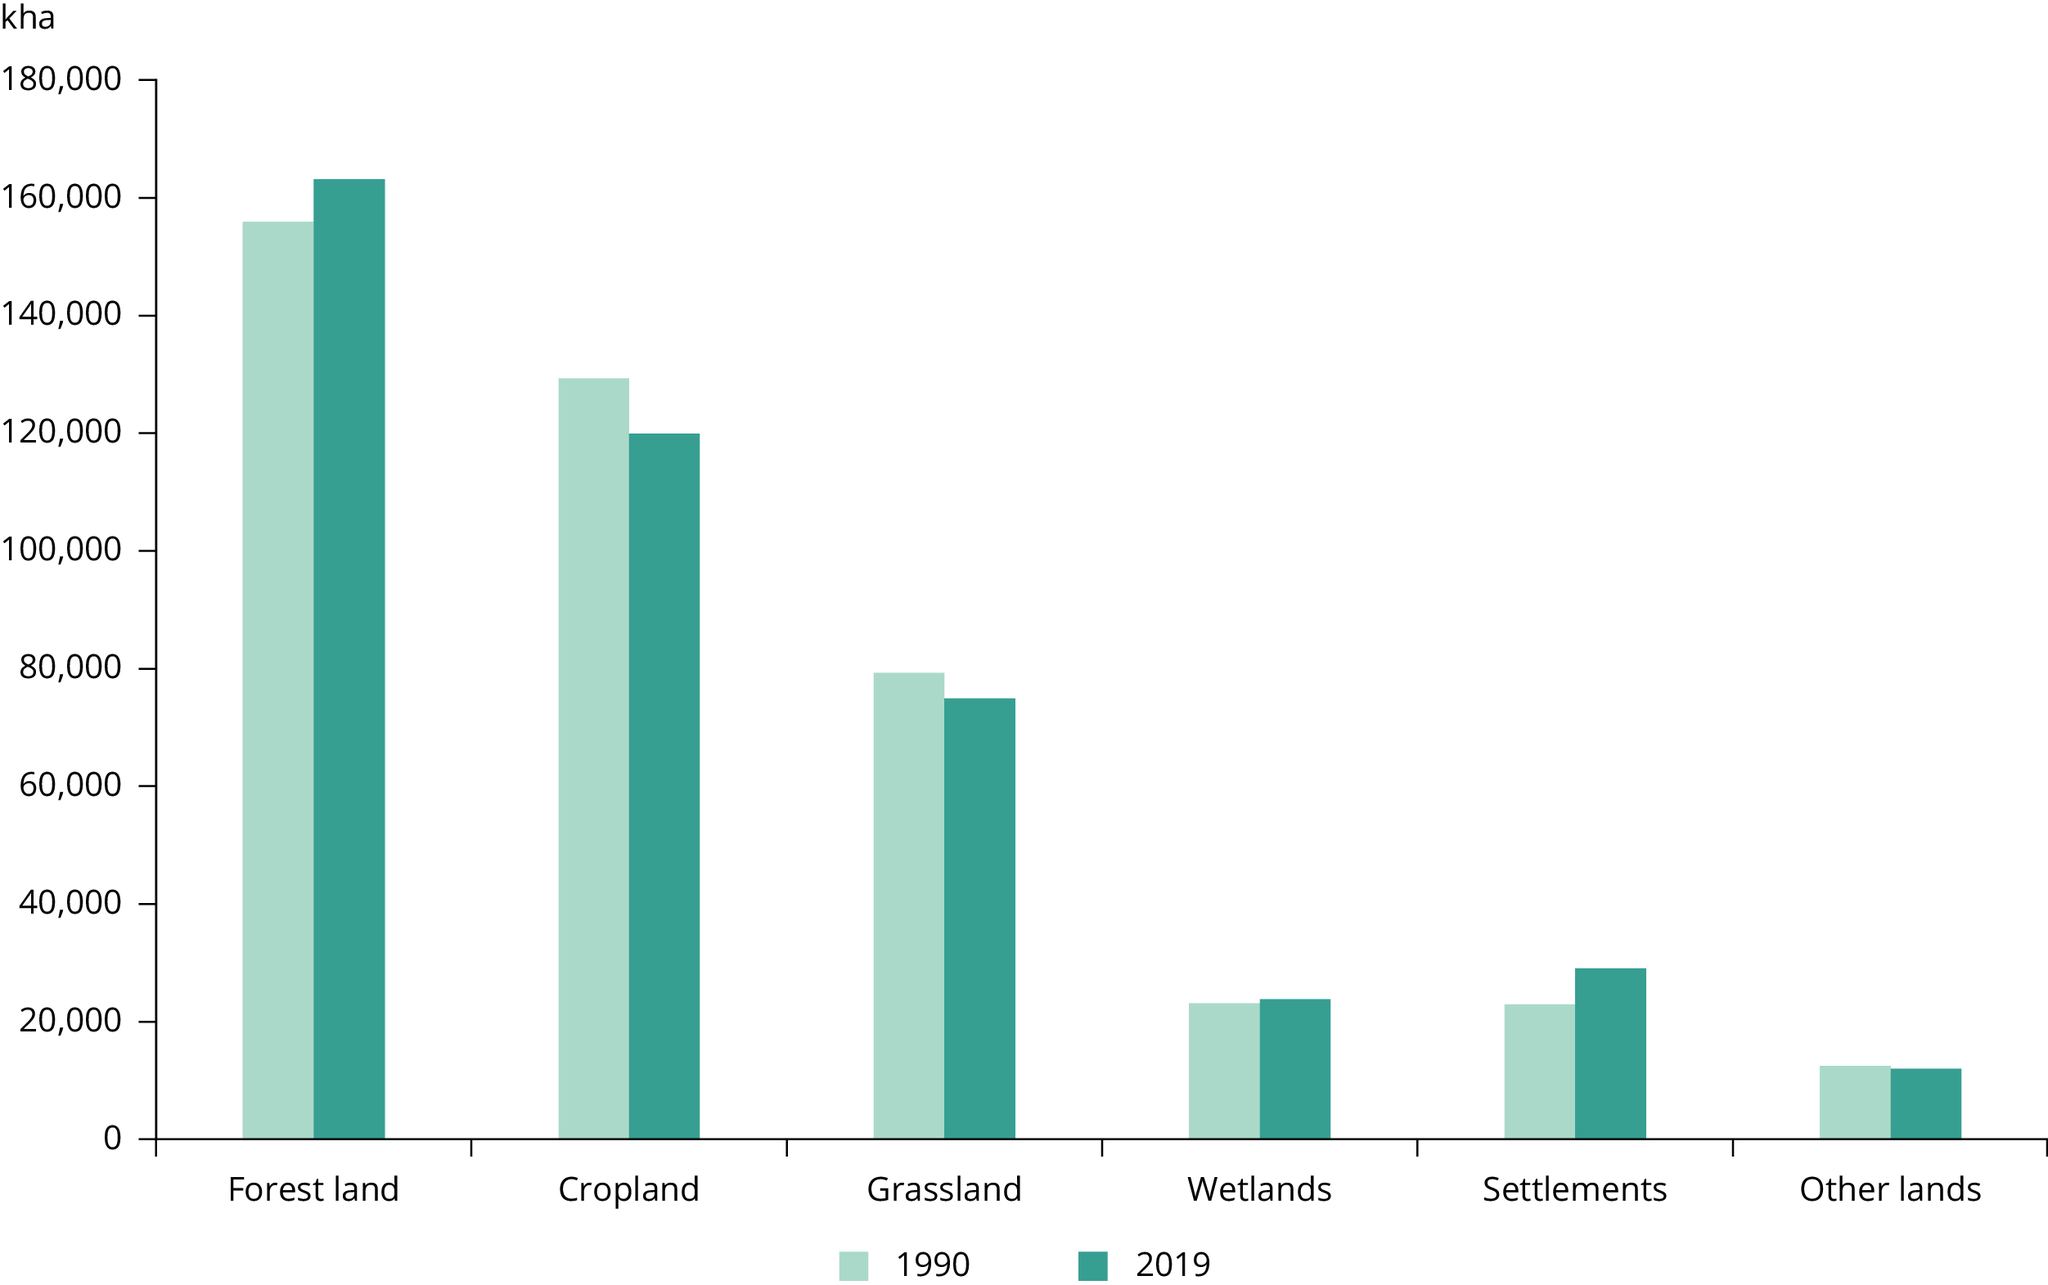
The area of organic soils decreased by 0.46Mha during the period 1990-2019. This typically happens when a soil with a shallow layer of organic matter has been drained for a number of years and consequently loses so much carbon that it becomes a mineral soil.
As organic soils have a larger impact on overall emissions than mineral soils per hectare, this decrease in the area of organic soils, together with a decrease in the cropland area (see Figure 6), has reduced overall emissions from soils in the EU since 1990.
Click here for different chart formats and data
While the areas of cropland and grassland with organic soil amount to only 1.3 million hectares and 2.8 million hectares, respectively (see Figure 2), these soils are responsible for 71% of the GHG emissions from organic soil. The larger area of organic soil used for forest land and wetlands together is responsible for only 26% of total emissions from organic soil.
Note: 20 EU Member States reported emissions from organic soils.
Click here for different chart formats and data
Germany is the Member State with by far the most emissions from organic soil (see Figure 7). This corresponds well with the country’s area of organic soil under cropland and grassland. Germany, Finland, Ireland, Sweden, Latvia, the Netherlands and Denmark together report 89% of the total EU emissions from organic soil.
Greenhouse gases other than CO2
In addition to CO2, CH4 and N2O are the two other GHGs associated with soil management. Both have a global warming potential larger than CO2. According to the IPCC fourth assessment report, 1t of CH4 corresponds to 25t CO2, while 1t N2O corresponds to 298t CO2. N2O emissions are generally due to the addition of nitrogen to the soil, such as input from fertilisers, manures and crop residues and loss of carbon due to changes in management and drainage of organic soil. CH4 emissions are linked to the decay of organic material under anaerobic conditions, which arise when drained soil is rewetted. Both gases are also emitted during the burning of biomass[2]. For the inventory year 2019, Member States reported emissions of 2.32Mt CO2e and 4.45Mt CO2e for CH4 and N2O, respectively, as a result of drainage and rewetting of organic soil. Member States reported 13.16Mt CO2e for N2O emissions from the cultivation of histosols in the agricultural sector.
Management of soils has wide implications for achieving EU environment policies
The EU has set a legally binding target of climate neutrality in 2050 and this includes an important role for the LULUCF sector including soils in reducing overall EU emissions. Besides the role of soils in climate change mitigation policy, soil management decisions will also impact other policy areas such as the biodiversity, the soil and the farm to fork strategies, so it is important to understand synergies and trade-offs between environmental impacts of climate-related soil management measures.
The IPCC 6th Assessment Report on mitigation of climate change mentions afforestation, enhanced sequestration in cropland and grasslands, use of biochar, peatland and costal wetland restoration and agroforestry as mitigation options with a positive impact on soil carbon storage. Depending on the measure and the implementation there can be important co-benefits such as improved soil quality, nutrient recycling, resilience to drought, increased crop yields, improved biodiversity and reduced N2O and CH4 emissions.
Trade-offs also depend on the specific measure and how it is implemented and can result in increased competition for land when measures have negative impacts on food production and on biodiversity, and increase N2O and CH4 emissions as well of the risk of subsequent loss of sequestered carbon due to climate change and future disturbances (IPCC, 2022).
Management practices that reduce emissions of one GHG, and in some cases increase another GHG, underscore the importance of having scientifically sound methods for estimating the net GHG impact of land use management practices, as well as the impact of the same management practices on nature restoration.
Notes
[1]Greenhouse gas inventories presented by Member State can be found on the UNFCCC website: National Inventory Submissions 2021.
[2]More information can be found in Chapter 11 of volume 4 of the 2006 IPCC guidelines for national greenhouse gas inventories (IPCC, 2006).
References
European Commission, 2021, ‘European Climate Law’ (https://ec.europa.eu/clima/eu-action/european-green-deal/european-climate-law_en)https://ec.europa.eu/clima/eu-action/forests-and-agriculture/land-use-and-forestry-regulation-2021-2030_en#:~:text=The%20LULUCF%20Regulation%20simplifies%20and%20upgrades%20the%20current,emissions%20and%20removals%20from%20actions%20in%20their%20forests) accessed 30 June 2022.
IPCC, 2006, 2006 IPCC guidelines for national greenhouse gas inventories, Intergovernmental Panel on Climate Change. (https://www.ipcc.ch/report/2006-ipcc-guidelines-for national-greenhouse-gas-inventories/) accessed 4 July 2022
IPCC, 2019, 2019 refinement to the 2006 IPCC guidelines for national greenhouse gas inventories, Intergovernmental Panel on Climate Change (https://www.ipcc.ch/report/2019-refinement-to-the-2006-ipcc-guidelines-for-national-greenhouse-gas-inventories/) accessed 30 June 2022.
IPCC, 2022, IPCC 6th Assessment Report, WG3, Chapter 12 www.ipcc.ch/report/ar6/wg37 accessed 11 August 2022.
Identifiers
Briefing no. 14/2022
Title: Soil carbon
EN HTML: TH-AM-22-015-EN-Q - ISBN: 978-92-9480-494-5 - ISSN: 2467-3196 - doi: 10.2800/680093
EN PDF: TH-AM-22-015-EN-N - ISBN: 978-92-9480-493-8 - ISSN: 2467-3196 - doi: 10.2800/822511

Document Actions
Share with others