| indicator |
policy issue |
DPSIR |
assessment |
| designated area under the Ramsar
convention |
how much wetland is protected from
damage or loss? |
response |
 |
| land cover in and around Ramsar
areas |
what are the pressures on
wetlands? |
pressure |
 |
| proximity of transport
infrastructure to Ramsar areas |
- " - |
pressure |
 |
| wintering waterbirds |
how are pressures influencing the
existence and distribution of flora and fauna? |
state |
 |
Despite global and national recognition of
their importance, Europe’s wetlands remain under severe pressure
from land use and pollution. Many wetland areas border agricultural
land and most are near transport infrastructure. One positive sign
is the increase in the population of a number of wintering
waterbirds, but this may be partly due to recent mild winters. All
EEA member countries have now ratified the Ramsar Convention, but
the process of designation to protect important wetlands takes many
years to complete.
Wetlands are a characteristic feature of many
landscapes, either as a major landform or as small and scattered
areas. Their wide range covers marine, coastal and freshwater
wetlands (lakes, rivers, bogs and marshes). Wetlands depend
completely on the hydrological cycle (both natural and regulated by
man) of the surrounding water catchment area. Because they receive
and retain water from their surroundings, wetlands accumulate
chemicals and sediments from these areas and are also subject to
eutrophication (see Chapter 13).
Wetlands have a range of functions and are
crucial for both chemical decomposition and as carbon sinks. They
supply drinking and process water, provide fisheries and
irrigation, act as a buffer against flooding, receive sewage water,
support transport conduits, act as a source of hydroelectricity,
and provide resources such as peat, game and berries. They also
have enormous recreational value.
Although regulation and drainage of wetlands
have been common practice in several areas of Europe for centuries,
intervention has increased over the past 50-100 years. About
two-thirds of the European wetlands that existed 100 years ago
have been lost (European Commission, 1995) leading to a substantial
decrease in the number, size and natural habitat of large bogs and
marshes, and small or shallow lakes. This has changed both the
visual landscape and environmental functions. The trend continues,
albeit more slowly.
Although more wetlands are being restored, this
does not make up for old or new losses. Restoration involves
deregulation of rivers, closure of drainage systems, active pumping
of water to wetlands and returning mineral quarries to wetlands.
Use of the riparian zones of wetlands as nutrient traps and for
sewage treatment is also becoming more widespread.
A large proportion of wetlands of international
importance has been designated as Ramsar sites — after the
Convention on Wetlands of International Importance especially as
Waterfowl Habitat, adopted at Ramsar in Iran in 1971 (Figure
14.1). Other important legal instruments are the EU Birds Directive
1979 and the EU Flora, Fauna and Habitats Directive 1992. The
Convention on Migratory Species (Bonn Convention) and the Bern
Convention also promote wetland conservation. In addition, most
European countries have specific national measures for wetland
protection.
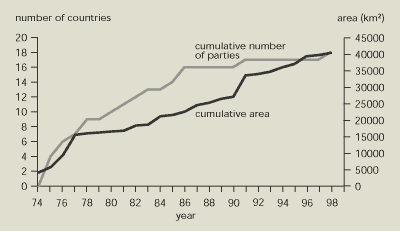
Figure 14.1:
Contracting parties and total area designated under the Ramsar
Convention by EEA member countries
Source:
Ramsar Bureau
 There is considerable national interest in global protection of
wetlands, but national strategies vary and implementation takes
time.
By 1986, 14 EU Member States and 2 EFTA
countries had ratified the Ramsar Convention; by 1998, all 18 EEA
member countries had signed. Table 14.1 shows the year of
ratification, the number of areas and the total surface area
designated. However, these figures give no indication of the
quality of the designated areas and their subsequent management.
Such evaluations have not yet been carried out. A comprehensive
overview of the state of remaining unprotected valuable wetlands is
also lacking.
14.1. Pressures on wetlands arising from land
use
Pressures on wetlands arising from land use in
and around the wetland are due to a combination of land management,
fragmentation, drainage and regulation, chemical and sediment
pollution.
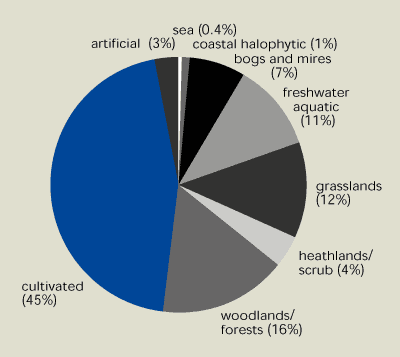
Analysis of the land cover of important
European wetlands (based on wetlands designated as Ramsar areas)
gives a useful indicator of pressures from land use on wetlands
(Figure 14.2). The known surface area of each Ramsar site has been
used to define a circular area at the location of each site.
Wetland habitats such as seas, rivers, lakes, bogs and marshes of
course charaterise these circular land and sea areas. However, a
considerable amount of agricultural activity takes place in and
close to Ramsar areas. Restriction of the analysis to Ramsar sites
(due to lack of other data) means it does not necessarily reflect
the full variety of important wetland types in each country.
About half the area in the coastal wetlands
analysed in Figure 14.2a is classed as sea and about half as
terrestrial. Around half the terrestrial area is under cultivation
and about a fifth is grasslands (used for grazing or under
grass-harvesting management). Urban areas, harbours, roads, etc
occupy about 5 % of the terrestrial area. Nearly two-thirds of the
area of inland wetlands (Figure 14.2b) is either cultivated or
woodlands, while grasslands occupy just over one-tenth. The
built-up area is slightly smaller than that for coastal and marine
wetlands.
The high level of agricultural land in and
around Ramsar areas means that maintaining the future value of
wetland areas is closely connected with changes in agricultural
practice and intensity, and with the maintenance of grasslands. In
some cases, agricultural areas may be beneficial, for example in
keeping the landscape open and allowing birds to feed, graze and
rest on fields and grasslands. However, it is sometimes more
profitable for the farmer to set aside land or to grow certain
crops than to enter an agri-environmental scheme with payments for
landscape management (see Chapter 6). The present analysis does not
identify the nature and the benefits of agricultural land use
around Ramsar areas.
Figure 14.2a.
Land cover in and around coastal and marine Ramsar areas in
southern and north-western Europe

Figure 14.2b.
Land cover in and around inland Ramsar areas in southern and
north-western Europe
Source: Ramsar
Bureau; Wetlands International; EEA Corine Land Cover; EEA-ETC/LC
and EEA-ETC/NC
Notes: Analysis covers Ramsar areas in Austria, Belgium,
Denmark, France, Germany, Greece, Ireland, Italy, Luxembourg, the
Netherlands, Portugal and Spain. Sparsely vegetated areas in both
coastal/marine and inland wetlands in these countries cover less
than 1 %. The analysis is based on circular areas of land with a
radius corresponding to the surface area of the individual Ramsar
areas concerned. Habitat information was derived from Corine Land
Cover data. Due to limitations in land cover analysis, habitats
covering less than 25 ha are not considered. Despite this, the
results highlight a significant pattern. The data, which are for
the 1990s, do not allow comparison with previous
decades.
 Many Ramsar wetland areas in southern, central and
north-western Europe include or are surrounded by agricultural
land. This makes them sensitive to farming practices.
14.2. Pressures on Ramsar areas from
infrastructure
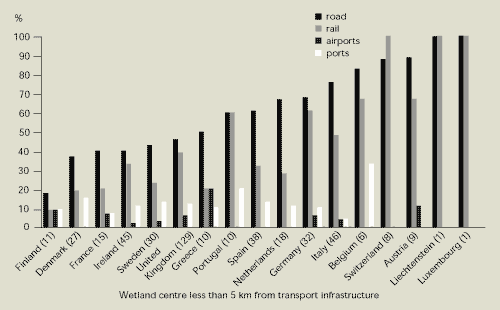
Analysis of the pressures on European wetlands
arising from the fragmentation and disturbance created by roads,
railways, airports and harbours either within or near wetlands
shows that most Ramsar areas are near major infrastructure elements
(Figure 14.3).
Roads have a major impact on wetlands in
countries with a dense infrastructure, such as Austria, Belgium,
Denmark, Germany, Luxembourg and the Netherlands. Railways tend to
influence fewer areas, but many areas are under pressure from both
roads and railways. Although airports give rise to fewer proximity
problems, their large sealed surfaces can have significant local
impacts. The pressure on existing Ramsar areas is expected to
increase as transport networks expand. It will also become harder
to designate new areas for protection that are not already
influenced by infrastructure.
Figure 14.3:
Proximity of transport infrastructure to Ramsar areas in selected
European countries
Source: Ramsar
Bureau; Wetlands International; EEA- ETC/LC
Note: Number of Ramsar areas included in analysis is given in
brackets.
 Most Ramsar areas are near major infrastructure elements.
Throughout Europe, roads and railways cause the greatest proximity
problems. The possibility of designating new protected areas
without proximity problems is becoming smaller.
| Tir Gwlyb I Gymru/Wetlands for Wales |
|
Morfa Borth, an estuarine peatland complex in Wales, was drained
in the 19th century by the re-routing of a nearby river, the Afon
Leri. Morfa Borth is one of 19 Welsh wetlands that will be restored
by Tir Gwlyb I Gymru/Wetlands for Wales, a collaborative project
which recently obtained a £3.6 million grant from the UK Heritage
Lottery Fund. The overgrown site will be restored by: raising the
water table through the creation of four sluices; allowing brackish
water to flow back into the area; and managing grazing to control
the spread of scrub. The restored site should attract back wetland
birds, plants and otters.
The loss of many natural Welsh wetlands through land drainage,
peat extraction and agriculture has resulted in the disappearance
of birds such as bitterns and marsh harriers, while numbers of
other species, such as lapwing and snipe, have fallen
significantly. Once restored, the 19 Welsh sites will form 26 % and
18 % of the UK's fenland and reed bed areas respectively.
Source:
Environment Agency
|
14.3. Waterbirds in mild winters
European wetland habitats are home to a wide
range of plant and animal species. They also play an important role
for large numbers of migrating birds and fish. However, species
composition has changed dramatically – with more widespread and
robust species predominating – as a result of water pollution and
eutrophication, regulation, invasion of new species and stocking
with fish. An increasing number of specialised natural animal and
plant communities now exist only in the upper reaches of
unregulated rivers, in clean lakes, and in unpolluted bogs and
marshes.
The quality and geographical distribution of
wetlands are crucial to the survival of many of Europe’s migrating
bird populations. Changes in the number of bird species and bird
population are often used as signals of general changes in the
condition of and pressures on ecosystems.
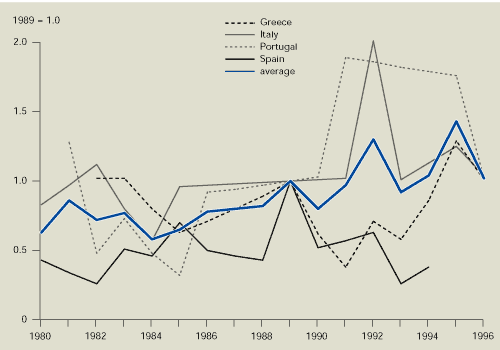
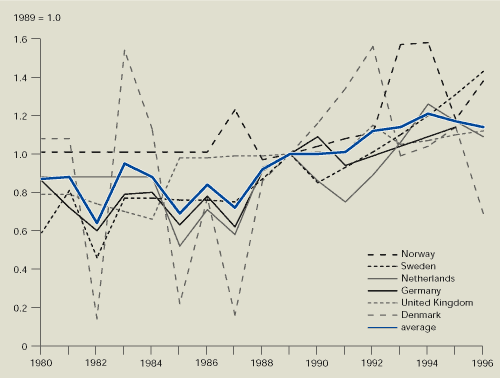
Since 1967, field counts of wetland birds in
their wintering wetland habitats have been undertaken as part of
the International Waterbird Census (IWC) project. Data on 23
open-water species in 12 European countries (e.g. swans, ducks and
the common coot) has been combined in an index. This index shows a
slight overall increase, with the largest increase in north-western
Europe (Figure 14.4). Increases in some bird populations are
interpreted as being linked to the milder nature of the winters in
these countries during this period. The effects of the very cold
winters of 1982, 1985, 1987 and 1996 are reflected in the figures
for several countries. For many species, however, the increases may
only mean that numbers are recovering under favourable wintering
conditions.
 The population of several wintering waterbirds has increased;
mild winters seem to have helped.
Figure 14.4a.: Index of wintering waterbirds in four Mediterranean
countries
Source:
Ramsar Bureau, Wetlands International, EEA-ETC/NC
Figure 14.4b.: Index of wintering waterbirds in six north-western
European countries
14.4. Indicator development
The indicators described in this chapter could
be improved by including more types of wetlands; by using digitised
boundary information to map the full extent of wetlands and overlay
them with other spatially referenced data sets on human activities
and environmental pressures that contribute to environmental
impacts; and by updating land-cover information to allow
comparisons with previous years. Information from more countries
and on other species would improve the bird species indicator, as
would analysis of the extent to which species numbers are changing
as a result of factors other than environmental impacts (e.g.
weather patterns).
For the future, indicators will be developed on
the impacts of human activities (transport, agriculture, industry)
and environmental pressures (emissions, resource extraction) on the
quality wetlands and other protected areas. Indicators and analysis
of the effectiveness of international conventions for protecting
the extent and quality of protected areas and the species that rely
on them will also be developed.
| Table 14.1: Ramsar ratification, area
and number of areas in EEA member countries |
| Country |
Total surface area of country, not including marine
areas (km2) in 1994 |
Date of ratification |
Total Ramsar surface area (including marine parts)
(km2) |
Total number of Ramsar areas in 1998 |
| Austria |
83 858 |
1983 |
1 028 |
9 |
| Belgium |
30 518 |
1986 |
79 |
6 |
| Denmark |
43 094 |
1978 |
7 390 |
27 |
| Finland |
338 145 |
1975 |
1 013 |
11 |
| France |
543 965 |
1986 |
5 791 |
15 |
| Germany |
356 970 |
1976 |
6 712 |
32 |
| Greece |
131 957 |
1975 |
1 635 |
10 |
| Ireland |
70 285 |
1985 |
697 |
45 |
| Italy |
301 323 |
1977 |
569 |
46 |
| Iceland |
103 000 |
1978 |
590 |
3 |
| Liechtenstein |
160 |
1991 |
1 |
1 |
| Luxembourg |
2 568 |
1998 |
3 |
1 |
| Netherlands |
41 526 |
1980 |
3 249 |
18 |
| Norway |
323 880 |
1975 |
697 |
18 |
| Portugal |
91 905 |
1981 |
658 |
10 |
| Spain |
505 990 |
1982 |
1 579 |
38 |
| Sweden |
449 964 |
1975 |
3 828 |
30 |
| UK |
244 101 |
1976 |
4 843 |
129 |
| EU |
|
|
39 049 |
427 |
| EEA |
|
|
40 337 |
449 |
| Source: Wetlands International; Ramsar Bureau, EIONET; Eurostat
(country area) |
Notes: Total
country area does not include marine areas, but comprises estuaries
and water lying on the land side of the normal baseline along the
coast. A simple country comparison of the ratio between columns 2
and 4 is impossible because wetlands consist of both large marine
and terrestrial areas. Ramsar areas in Denmark, for instance,
consist of about 1 400 km2 land area and 6 000
km2 marine area.
14.5 References and further reading
European Commission (1995). Commission’s
communication to the Council and the Parliament: wise use and
conservation of wetlands. European Commission, Brussels,
Belgium.


Document Actions
Share with others