The need to reduce air pollution in Europe
Air pollution is the single largest environmental health risk in Europe. It leads to more than 400 000 premature deaths each year, shortening lifespans and contributing to serious illnesses such as heart disease, respiratory problems and cancer. It also causes soil and surface water acidification, harms crops and leads to grassland species loss due to eutrophication.[1]
Under the National Emission Ceilings Directive (NECD),[2] EU Member States have individual air pollutant emission limits, or 'ceilings', restricting emissions for four important air pollutants: nitrogen oxides (NOx), non-methane volatile organic compounds (NMVOCs), sulphur dioxide (SO2) and ammonia (NH3). As of 2010, all Member States are required to meet their emission ceilings.
This briefing presents the latest preliminary emissions data reported by Member States for 2014 as well as ‘final’ data for the preceding years – 2010 to 2013. It also presents progress of the European Union (EU)[3] in meeting its aggregated ceilings as specified in the NECD.
A number of Member States exceeded their emissions ceilings for NOx, NH3 and NMVOCs during the period 2010 to 2014. While all EU Member States have reduced their emissions of air pollutants since 2010, ten countries still continued to exceed one or more of their national NECD ceilings in 2014. The EU-28 as a whole did not exceed its aggregated emission ceilings for any of the four air pollutants in 2014.
Comparison of Member State emissions with respective NECD ceilings
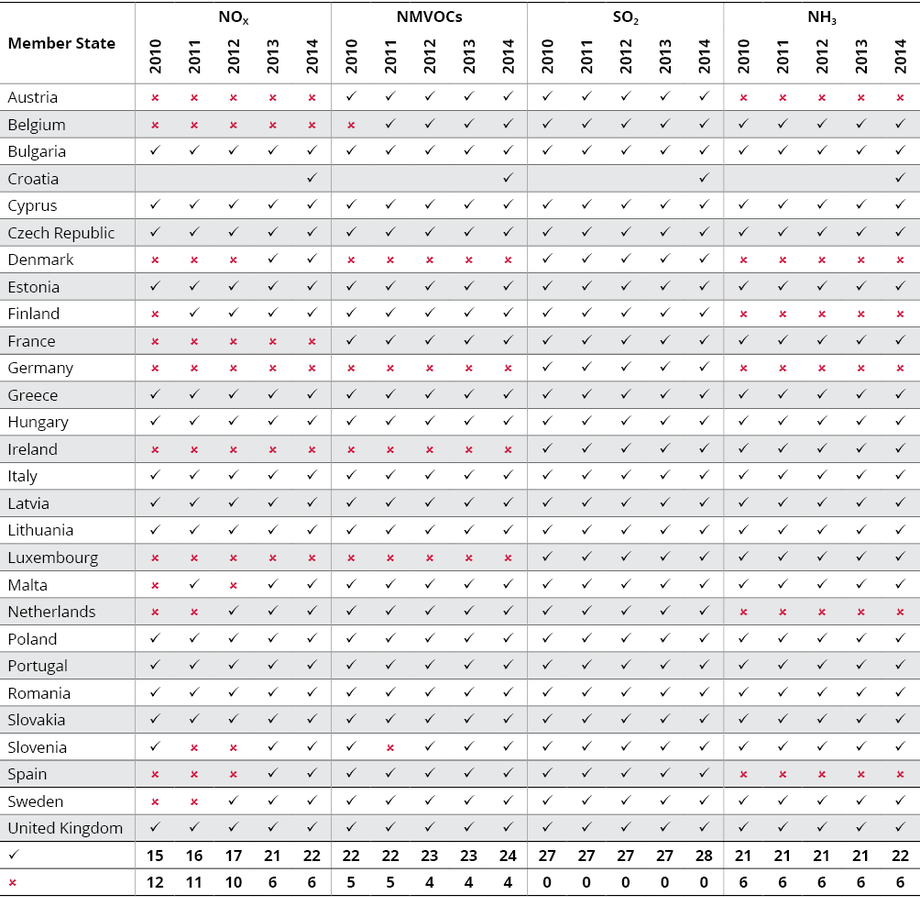
Notes: ‘v' indicates that the emission ceiling has been attained; ‘x’ indicates that the ceiling has not been attained. 2010, 2011, 2012 and 2013: final data; 2014: provisional data.
In some cases, the ceiling could have been attained on the basis of adjusted emission inventories as approved under the Gothenburg Protocol of the LRTAP Convention (see Box 1).[4][5] In particular for 2013 and 2014, the number of exceedances above the 2010 NECD emission ceilings would become fewer.
Nitrogen oxides (NOx)
Six Member States exceeded their NOx emission ceilings in 2014. Austria and Luxembourg exceeded their NOx ceilings the most, by 26 and 29 %, respectively. The largest emitters of NOx in 2014 were Germany, the United Kingdom, and France. Between 2013 and 2014, 21 Member States reported emission reductions for NOx. The total reduction for the EU-28 between 2013 and 2014 amounts to − 4.7 %.
Non-methane volatile organic compounds (NMVOCs)
In 2014, four Member States (Denmark, Germany, Ireland and Luxembourg) did not attain their ceilings. The highest exceedance in 2014, in percentage terms, was reported for Ireland (58 %). The largest emitters of NMVOCs were Germany, Italy and the United Kingdom. Between 2013 and 2014, 23 Member States reported emission reductions for NMVOCs. The total reduction for the EU-28 between 2013 and 2014 amounts to − 3.1 %.
Sulphur dioxide (SO2)
All Member States complied with the emission ceilings for SO2. The largest emitters of SO2 were Poland, Germany and the United Kingdom. Between 2013 and 2014, 23 EU Member States reported emission reductions for SO2. The total reduction for the EU-28 between 2013 and 2014 amounts to – 7.7 %.
Ammonia (NH3)
Six Member States (Austria, Denmark, Finland, Germany, the Netherlands and Spain) exceeded their NH3 ceilings in 2014. The highest exceedance, in percentage terms, was reported for Germany (35 %), the smallest for Austria (1 %). The largest emitters of NH3 were Germany, France and Spain. Between 2013 and 2014, 11 EU Member States reported emission reductions for NH3. There was an increase of 1.3 % for the EU-28 between 2013 and 2014.
EU progress in meeting its emission ceilings
The EU itself has two different sets of emission ceilings for 2010 and onwards, as set out in the NECD. With respect to the aggregated emission ceilings set for SO2, NOx and NMVOCs and NH3described in Annex I of the NECD, the final 2010-2013 and provisional 2014 emission data are lower than the respective 2010 ceilings (see Figure 1, table on Total emissions for compliance and interactive data viewer).
The stricter emission ceilings in Annex II of the NECD were designed to ensure that specific environmental objectives were met, such as targets limiting the acidification and eutrophication of European ecosystems. Annex II of the 2001 NECD does not include a ceiling for NH3 emissions. The aggregated NOx emission data for the 28 Member States of the EU were above the Annex II limit for the 2010 to 2012 period. Similarly the aggregated NMVOCs emissions were above the Annex II ceiling for 2010. In 2014, the EU-28 as a whole achieved all its Annex I and II emission ceilings.

Notes: Croatia joined the EU in mid-2013, therefore for the period 2010 to 2013 emissions and ceilings are shown for the EU-27. For 2014, emissions and ceilings are given for the EU-28.
The aggregated EU emissions for mobile sources are calculated based on data on fuel sold for 22 Member States and data on fuel used for 6 Member States (Austria, Belgium, Ireland, Luxembourg, the Netherlands and the United Kingdom).
Reasons for exceedances of emissions ceilings
Emissions from road transport contribute approximately 40 % to the EU-28 emissions total. They are one of the main reasons for the large number of NOx exceedances since 2010. NOx reductions from this sector have been lower than originally anticipated over the last two decades, partly because transport has grown more than expected, and partly owing to the larger than expected growth in diesel vehicles producing higher NOx emissions than petrol-fuelled vehicles. Furthermore, it is widely accepted that ‘real-world emissions’, particularly from diesel passenger cars and vans, generally exceed the permitted European emission (Euro) standards which define the acceptable limits for exhaust emissions of new vehicles sold in the EU Member States.
Six Member States continue to exceed their respective NH3 ceilings. About 94 % of NH3 emissions stem from agriculture, mainly from the handling of animal manure and the use of fertilisers. NH3 emissions have decreased since 1990, but not to anywhere near the same extent as the other pollutants covered by the NEC Directive. A number of technical measures exist to reduce NH3 emissions. A main reason in countries with high or even rising NH3 emissions is an increasing number of pig or poultry facilities, without implementing measures and/or technologies to limit emissions.
Box 1: Adjustments to emission inventories under the Gothenburg Protocol of the LRTAP Convention
In 2012, the Executive Body of the UNECE Convention on Long-range Transboundary Air Pollution (LRTAP)[6] decided that countries improving their emission inventories by incorporating previously unknown emission sources or increased emission factors should not be penalised when compliance was subsequently judged against fixed national ceilings. An ‘adjustments’ procedure was subsequently agreed under the Convention, allowing changes to emission reduction commitments, or to inventories, for the purpose of comparing total national emissions with them.
The ‘adjustments’ process encourages Parties to incorporate the latest science in their national emission inventories, and to incorporate scientific updates included in the latest versions of the EMEP/EEA air pollutant emission inventory guidebook.[7] Some countries have subsequently updated their emission inventories by applying new approaches recommended in the latest guidebook version. This has led, in some instances, to higher national emission totals. However, not all countries have yet included, for example, information on new emissions sources, meaning that the reporting from these countries is considered incomplete.
In 2014 and 2015, adjustment applications by Belgium, Denmark, Finland, France, Germany, Luxembourg and Spain were approved under the Gothenburg Protocol, addressing NOx, NMVOCs and NH3. Countries that have signed, but not ratified the protocol, for example Austria and Ireland, cannot apply for adjustments.[5] Had adjusted emissions also been applied under the NECD, the following Member States would not have exceeded their ceilings: Belgium NOx, 2010-2014 and NMVOCs, 2010; Denmark, NMVOCs, 2011-2014 and NH3, 2012-2014; France, NOx, 2014; Germany, NOx, 2014 and NMVOCs, 2010-2014; Luxembourg, NOx, 2013-2014.

Document Actions
Share with others