Source: EEA methane data viewer. More detailed greenhouse gas inventory data, including for other EEA member countries can be found in the EEA GHG data viewer.
Recent events at the two Nord Stream pipelines carrying natural gas from Russia to Germany resulted in large amounts of CH4 being released into the atmosphere in the exclusive economic zones of Denmark and Sweden. These events are beyond the control of climate policies, although they affect EU and Member State’s emissions and annual national emission targets. Based on the volume of gas in the leaking pipelines, the first estimates of the amount of CH4 released were 14.6Mt of CO2e (Danish Energy Agency, 2022). The CO2 equivalent emissions are based on a 100-year global warming potential (GWP) of 28 (from the Intergovernmental Panel on Climate Change (IPCC) fifth assessment report).
These first estimates are uncertain. It is not clear that all the natural gas has been released into the atmosphere, and the estimates also assume that the natural gas in the pipelines is pure CH4. For these reasons, the estimates reported could represent the maximum leakage. Noting that an accurate estimation is not possible right now, and that the actual leakage could be lower (Dinneen, 2022), the amount of CH4 gas already leaked is very significant at national and EU levels. Based on the 2022 EU GHG inventory submission to the UNFCCC, the estimated leakage reported, and occurring in just a few days, would correspond to about 90% of all fugitive emissions from natural gas operations in the EU in 2020 (or 0.5% of total EU net GHG emissions).
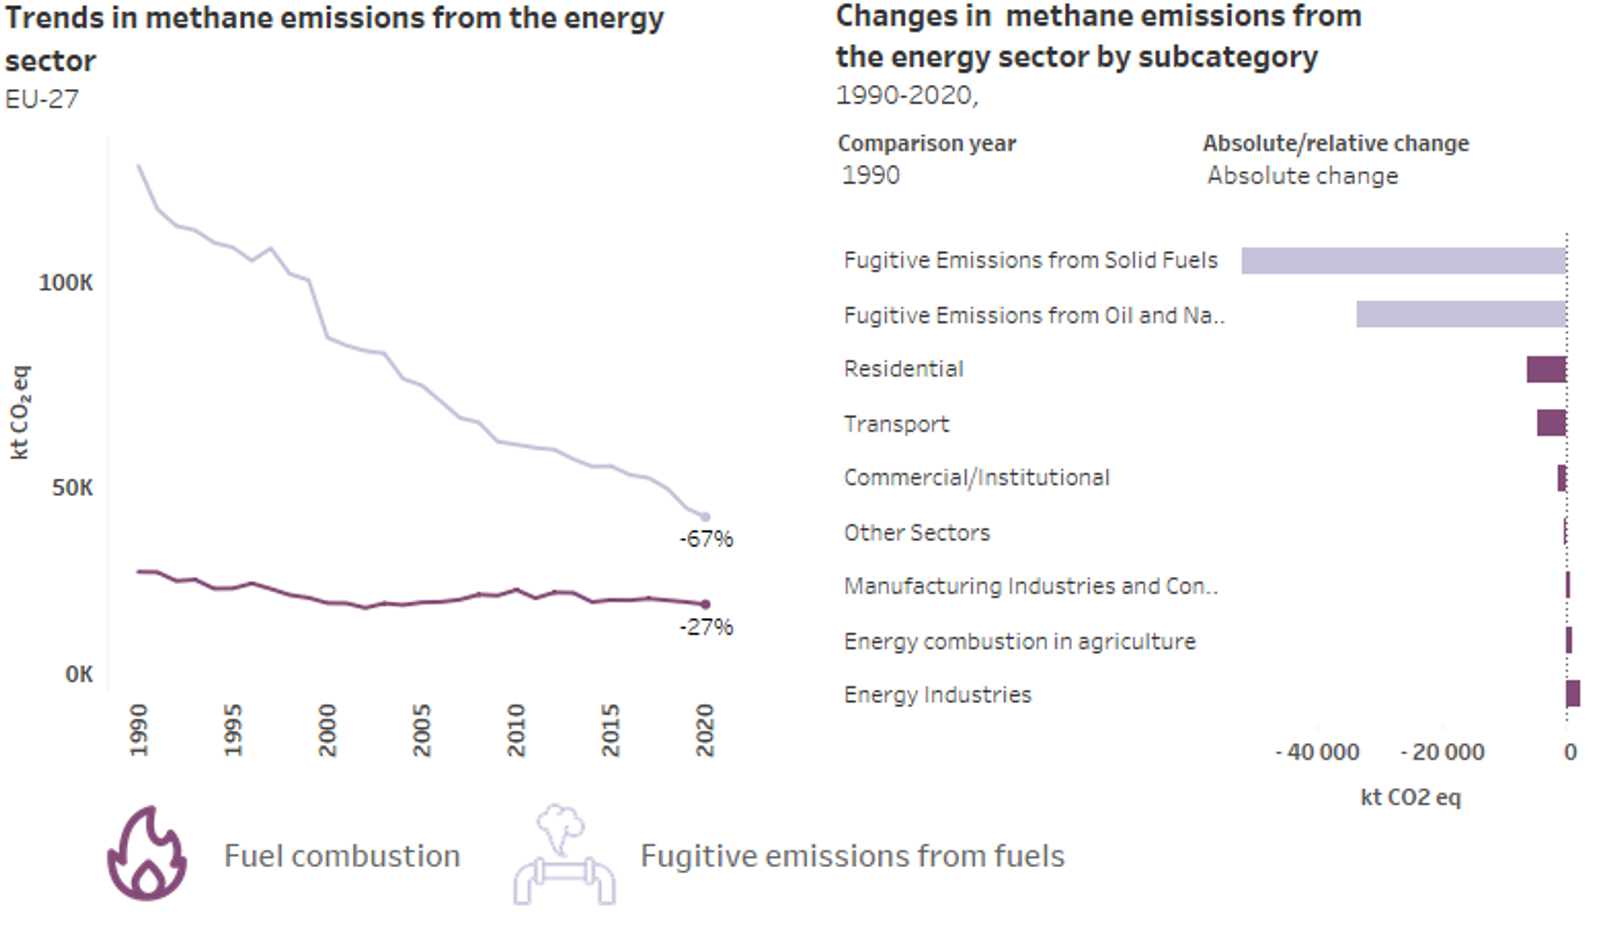
Current GHG projections reported by Member States until 2040 indicate that total CH4 emissions in the energy sector will continue decreasing in the future as countries implement EU and national legislation[6]. The EU has a policy framework in place to reduce GHG emissions (which include CH4), via the Effort Sharing Regulation, for the sectors not covered by the EU Emissions Trading System (ETS) and where national binding targets apply. The non-ETS energy sectors include residential and commercial buildings, transport (except aviation), and coal, oil and gas operations. The specific policies and measures at Member State level to achieve reductions in GHG emissions are available from the EEA’s policies and measures database.
Specifically, CH4 emissions should decrease further as countries implement the EU methane strategy (covering the energy, agriculture and waste sectors) and, once agreed, the EU Methane Regulation(applicable to the energy sector).
As part of the EU’s methane strategy, the European Commission has since adopted a legislative proposal to reduce CH4 emissions in the energy sector, covering oil, gas and coal and including:
- compulsory measurement, reporting and verification (MRV) for all energy-related CH4 emissions in the EU, building on the United Nations Oil and Gas Methane Partnership (OGMP 2.0) methodology for the oil and gas sectors;
- compulsory periodic leak detection and repair (LDAR) of CH4 leaks across all EU-based oil and gas operations;
- a ban on venting and on routine flaring, restricting them to unavoidable and strictly defined circumstances;
- for coal, a ban on venting of high-concentration CH4 from draining stations and, for ventilation shafts, limits on venting from thermal coal mines as of 2027;
- preparing an inventory of closed or abandoned assets (both wells and mines), measuring emissions and adopting a plan to mitigate these emissions;
- an obligation on importers of fossil fuel energy into the EU to provide information on CH4 emissions monitoring, measurement and abatement activities outside the EU with a view to establishing a CH4 intensity profile of exporter countries and external operators; a review clause in 2025 will consider more stringent measures on imports of fossil energy;
- setting up of a CH4 transparency database[7], which will contain the CH4 intensity profiles of exporter countries as well as EU and external operators; these will be developed from information including the importer’s obligation, the EU reporting requirements, and data from a global CH4 emitter monitoring tool to document high CH4 emitters globally; and
- establishing a global CH4 emitters monitoring tool, which will provide information on the extent, recurrence and location of high energy-related sources of CH4; the tool should pool data from the Copernicus component of the EU space programme and from the United Nations Environment Programme (UNEP) International Methane Emissions Observatory (IMEO).
More recently, triggered by Russia’s invasion of Ukraine and its consequences on energy supply and prices, the European Commission presented the REPowerEU plan, to make Europe independent from Russian fossil fuels before 2030 by accelerating the green transition. Renewables that can be produced domestically are considered the cheapest and cleanest energy available and scaling up renewables will reduce the EU’s need for energy imports. Among its key measures, the plan proposes (1) to expand capacity in solar and wind energy and deploy renewable hydrogen; (2) to increase the production of sustainable biomethane; (3) to boost industrial decarbonisation; (4) to increase energy savings and increase the EU-wide 2030 target for efficiency from 9% to 13%; and (5) an increase in the EU renewables 2030 target from 40% to 45%. These measures will reduce GHGs, including CH4, because they target lower fossil fuel dependency and improvements in renewable capacity and energy efficiency.
The implementation of planned and additional policies in the energy sector should reduce GHG emissions by 40% by 2040, some CH4 related, and support the EU’s 2030 target and climate neutrality by 2050.
According to IEA estimates, there are several technologies available to reduce CH4 emissions from oil and gas operations, and if all options were implemented, 75% of total oil and gas CH4 emissions could be avoided (IEA, 2022). The IEA also highlights that CH4 is a valuable product that can be sold if captured, and that about 40% of total emissions could be avoided with measures having no net cost (estimated at 2019 natural gas prices).
Lastly, emissions from coal mining and handling have decreased due to the closure of mines and a decrease in coal production of over 70% between 1990 and 2020, according to Eurostat energy statistics. Coal represented a substantial part of the energy supply in the EU, with most of it produced domestically. Even after closure, abandoned mines continue emitting CH4, and these emissions are substantially higher in underground mines than in surface mines.
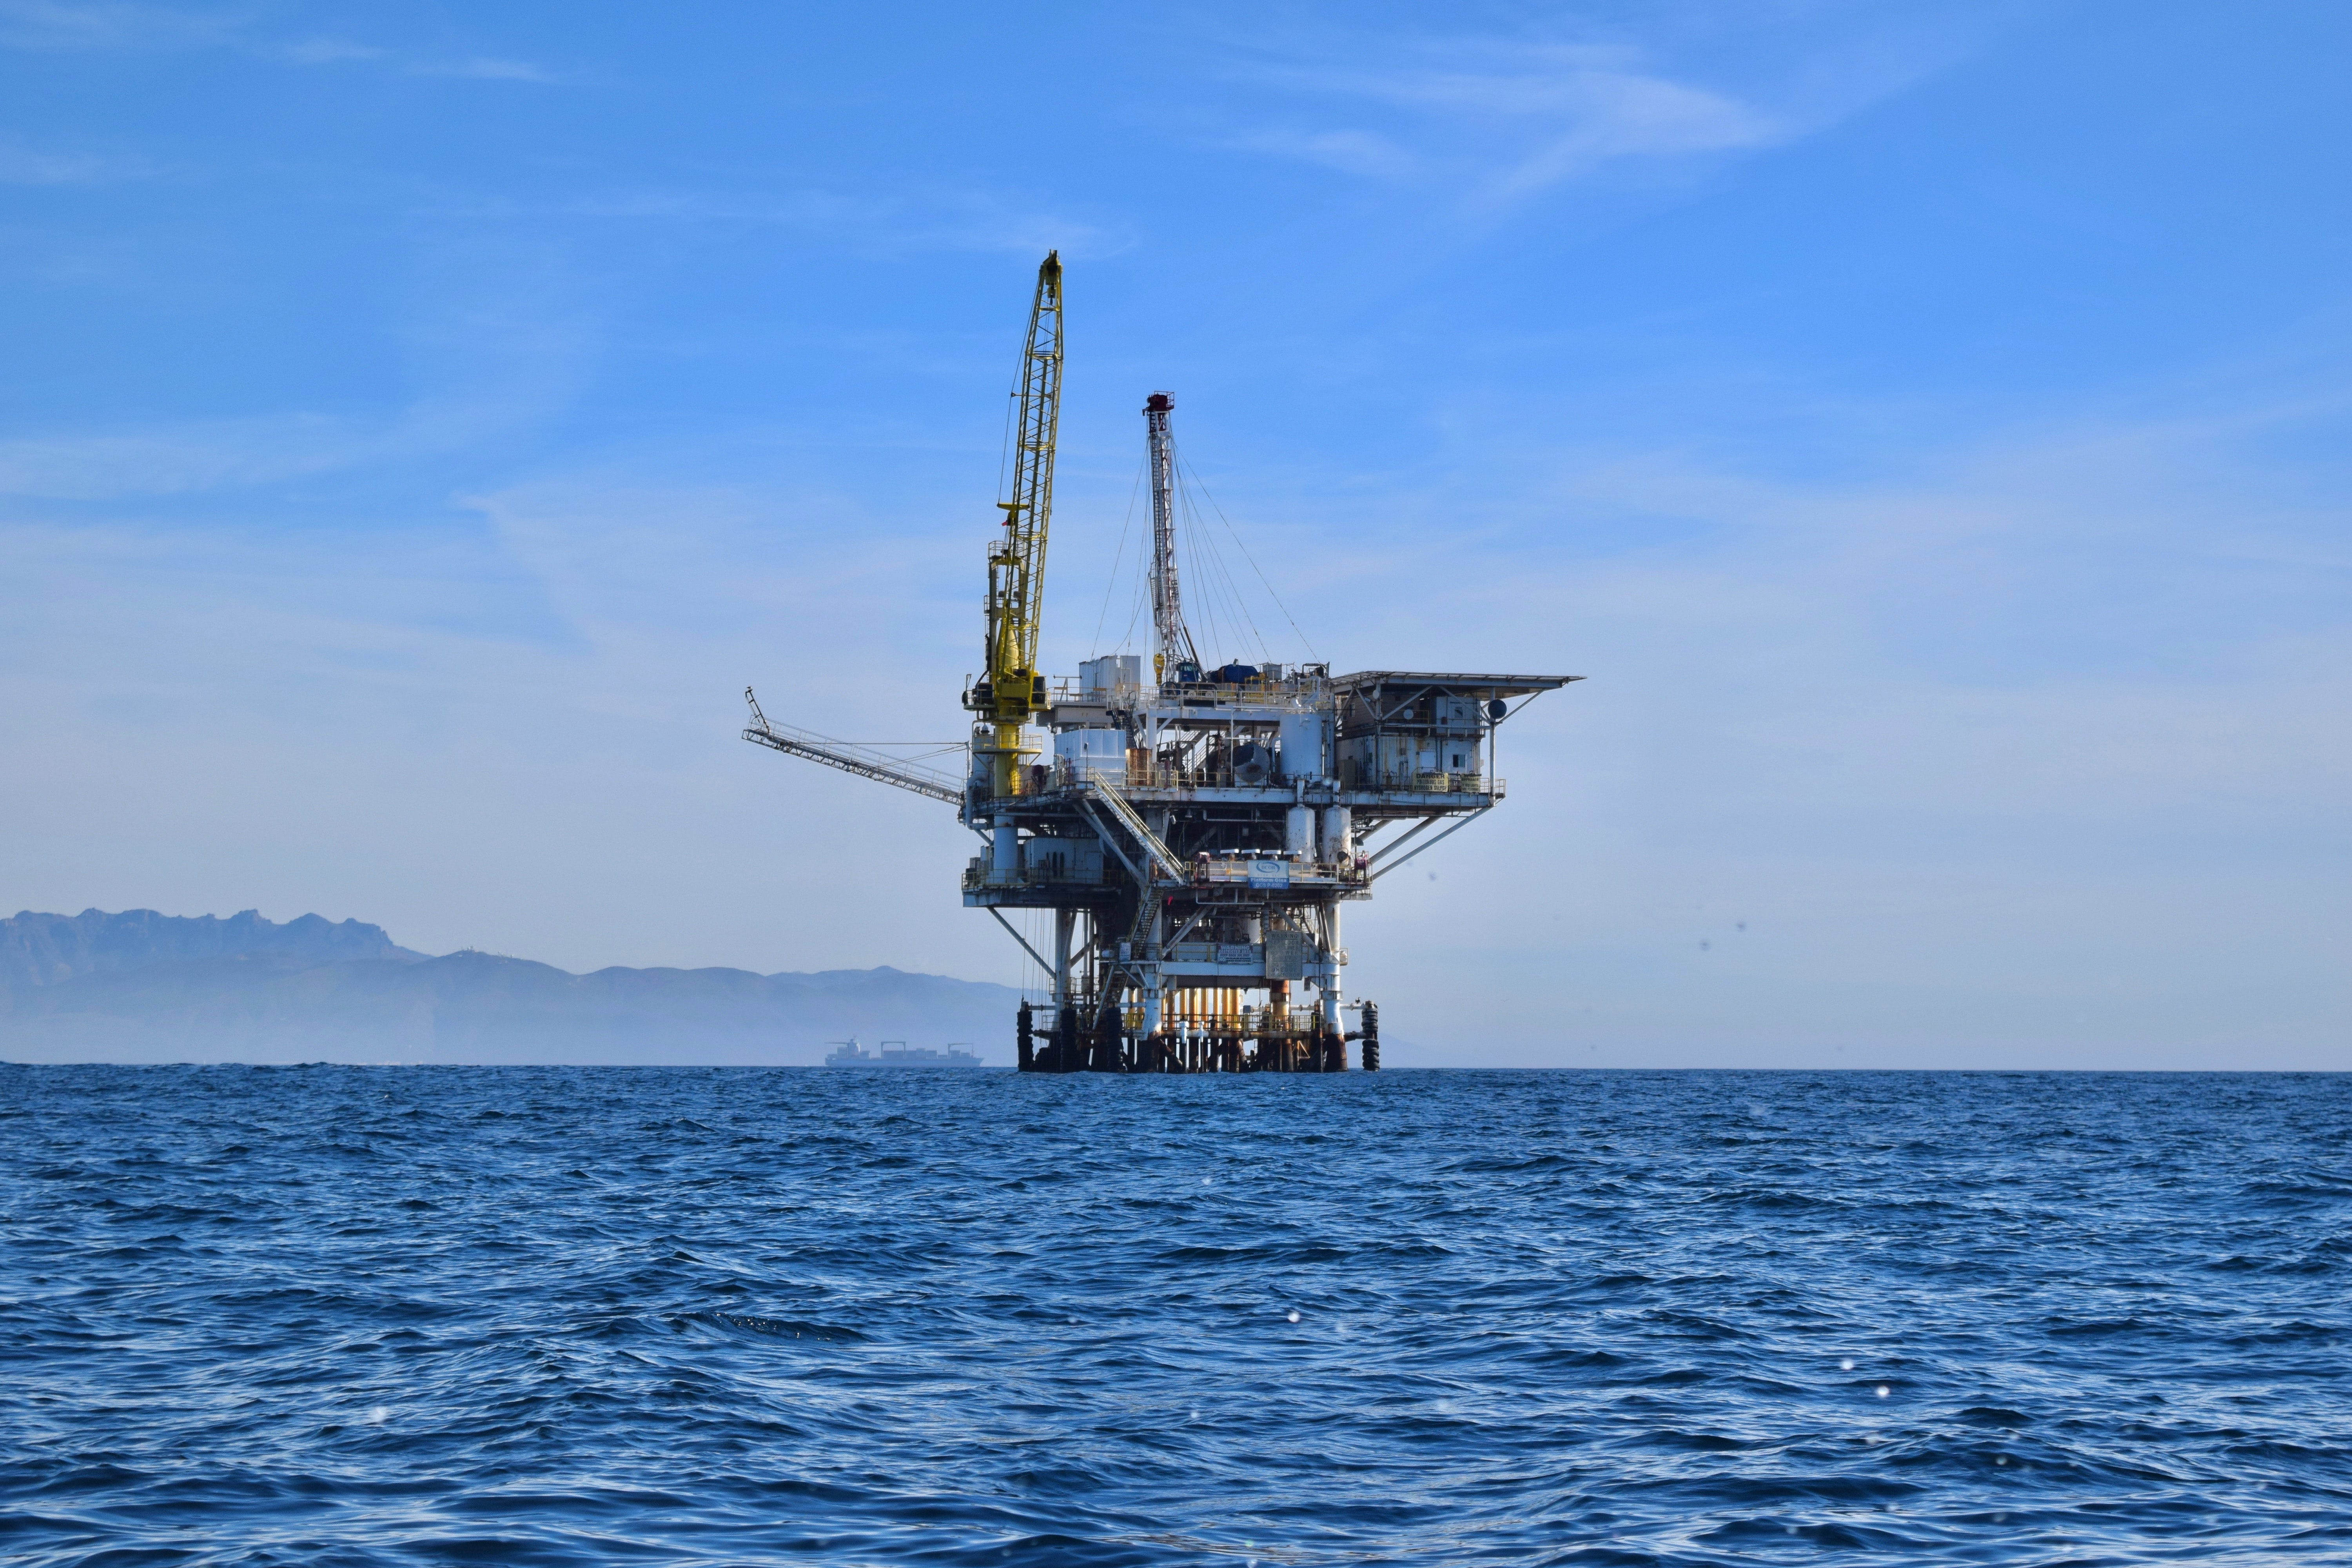
Coal is harmful in terms of GHG emissions and global warming, as well as in relation to air pollution and human health. Most emissions are CO2-related from combustion in power plants but there are also CH4-related emissions from incomplete combustion, as well as significant CH4 emissions linked to leaks in coal mining and handling, and from abandoned mines. As with oil and natural gas systems, the European Commission proposal on reducing CH4 emissions in the energy sector also envisages improvements in the measurement, reporting and verification of emissions from coal mines. Although EU climate policies have favoured less carbon intensive fuels to allow the EU to reduce its GHG emissions by at least 55% by 2030 and to become climate neutral by 2050, the transition is not easy and has important social and economic effects on the coal regions affected. In addition to the EU Just Transition Mechanism, which aims to ensure a fair transition towards a climate neutral economy, the EU’s initiative for coal regions in transitionhas the key objective of assisting Member States and coal regions to address the challenges of the transition to a low-carbon economy.
© Designed by TheDigitalArtist on pixabay.com
Methane in the agriculture sector in the EU
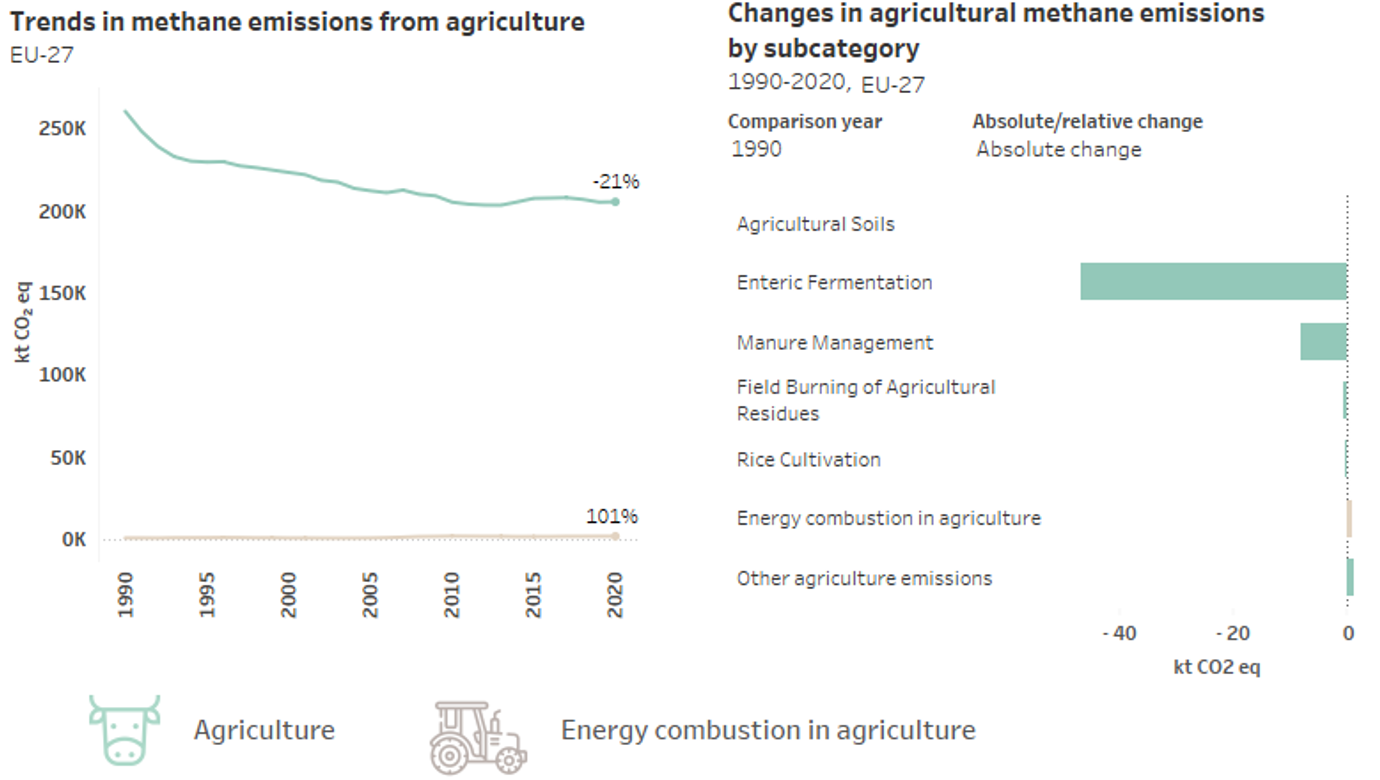
Based on the 2022 EU GHG inventory, the largest source of CH4 in the agriculture sector is the enteric fermentation (digestion process in ruminants) and management of livestock manure, particularly of cattle (77%), sheep (7%) and swine (10%). These three sources represented 94% of the 206Mt CH4 emissions in CO2e in the agriculture sector in 2020. Enteric fermentation from cattle alone accounted for 69% of CH4 emissions in the agriculture sector in the EU in 2020.
CH4 emissions in the sector decreased in the 1990s and 2000s, but have been rather stable since 2010 and even increased around 2015 (Figure 5). The common agriculture policy on market support had a significant impact on reducing agricultural emissions from enteric fermentation through the milk quota system[8], which led to a strong reduction in dairy cattle numbers to compensate for increasing productivity. Basically, controlling overproduction through milk quotas in the EU reduced the economic returns from cattle production and incentivised higher milk yields to sustain production levels with fewer cattle (UNFCCC, 2017). The EU’s health check of the common agricultural policy in 2009 led to the abolition of the milk quota system in 2015. A key reason for its abolition was that EU producers were prevented from responding to the growing demand for dairy products. Although CH4 emissions from enteric fermentation in dairy cattle decreased substantially in the EU between 1990 and 2010 (-27.9Mt CO2e), there was a net increase between 2010 and 2020 (+2.1Mt CO2e).
Source: EEA methane data viewer. More detailed greenhouse gas inventory data, including for other EEA member countries can be found in the EEA GHG data viewer.
The small net increase in CH4 emissions from dairy cattle since 2010 could be explained by several factors. Based on the common reporting tables underpinning the 2022 EU GHG inventory submission to the UNFCCC, the gross energy intake, the implied CH4 emission factor and the milk yield per cow increased between 2010 and 2020, albeit less rapidly than between 1990 and 2010. The population of dairy cattle also declined in the past 10 years, but substantially less rapidly than during the first 20 years since 1990. In addition, total milk production in the EU increased significantly between 2010 and 2020, compared with the period 1990-2010 when it declined. Overall, emission trends have been positive since 1990, and CH4 emissions have decreased substantially for dairy cattle and for the agriculture sector as a whole – even if the current and projected trends remain less encouraging.
Changes in the agricultural management of manures, including the production of biogas in anaerobic digesters, and using the recovered CH4 (as biogas or biomethane) in the energy sector for producing heat and electricity has also resulted in decreased CH4 emissions. This is one measure that can improve the circularity of our production and consumption and help mitigate emissions in the future.
|
Year 2020 | Year 1990 |
GREENHOUSE
GAS SOURCE
CATEGORIES -
EYROPEAN
UNION
(KP) |
ACTIVITY DATA |
IMPLIED EMISSION FACTORS |
EMISSIONS |
ACTIVITY DATA |
IMPLIED EMISSION FACTORS |
EMISSIONS |
|---|
| Population size |
CH4 |
CH4 |
Population size |
CH4 |
CH4 |
| (1000s) |
(kg CH4/head/yr) |
(kt) |
(1000s) |
(kg CH4/head/yr) |
(kt) |
| Dairy cattle |
22,507.30 |
131.42 |
2957.82 |
39,309.86 |
102.70 |
4037.17 |
| Non-dairy cattle |
67,784.37 |
49.23 |
3337.35 |
86,781.70 |
45.24 |
3925.78 |
| Sheep |
98,752.08 |
7.23 |
714.18 |
147,701.01 |
6.89 |
1018.03 |
| Swine |
145,116.96 |
1.16 |
168.62 |
172,436.66 |
1.30 |
223.38 |
| Buffalo |
457.98 |
74.59 |
34.16 |
183.21 |
66.38 |
12.16 |
| Deer |
86.90 |
13.68 |
1.19 |
106.31 |
14.99 |
1.59 |
| Goats |
12,902.84 |
7.07 |
91.23 |
14,852.74 |
7.51 |
111.55 |
| Horses |
5,115.20 |
18.10 |
92.61 |
5,180.43 |
18.08 |
93.64 |
| Mules and asses |
250.13 |
10.00 |
2.50 |
1,033.51 |
9.85 |
10.18 |
| Poultry |
1,720,171.67 |
0.00 |
1.72 |
1,62,137.80 |
0.00 |
1.86 |
| Rabbit |
14,351.18 |
0.07 |
1.07 |
24,439.96 |
0.07 |
1.70 |
| Reindeer |
435.29 |
15.81 |
6.88 |
492.27 |
16.09 |
7.92 |
| Ostrich |
3.47 |
0.00 |
0.00 |
0.20 |
- |
- |
| Fur-bearing animals |
7,154.52 |
0.03 |
0.25 |
8,485.88 |
0.04 |
0.35 |
Note: The geographical coverage in this table includes the 27 EU Member States, Iceland and the United Kingdom. Emissions of CH4 can be converted to CO2e by multiplying emissions by the 100-year GWP of CH4 from the IPCC’s fourth assessment report, currently used for reporting to the UNFCCC, which is 25.
Source: EEA (2022c).
Table 1 shows the population, emission factors and emissions for different animal types in Europe in 1990 and 2020. Although there are fewer dairy cattle than beef cattle in Europe, the numbers show that the dairy herd emits more CH4 than the non-dairy herd. Per head, dairy cattle emit almost three times as much CH4 as non-dairy cattle. The emission factor (kg CH4/head/year) has also increased markedly since 1990 but much less than milk production per animal. There are also significant CH4 (and nitrous oxide, N2O) emissions from manure management associated with these types of animals that are not included in this table.
Assuming that production reflects and matches demand for consumption, Table 1 also suggests that larger reductions in CH4 emissions per kilogram produced would be achieved by reducing dairy consumption rather than reducing beef consumption. Technological advances in animal feed to reduce CH4 production from ruminants could further provide an alternative and/or additional means of mitigating CH4 emissions.
In addition to advances in and implementation of CH4-reducing practices and technologies in agricultural production, there are possibilities available to consumers regarding food choices that can also contribute to lower methane emissions.
Emissions from agriculture are covered by national emission targets under the Effort Sharing legislation. Although the available projections precede the adoption of key legislation and legislative proposals, current GHG projections reported by Member States indicate that total CH4 emissions in the agriculture sector are not expected to decrease up to 2030 (EEA, 2022b). The existing and planned policies and measures in place do not contribute sufficiently to achieving the reductions in GHG emissions needed to meet the EU’s 2030 target and 2050 climate neutrality objective.
The EU methane strategy proposes several policies and measures that countries should implement to accelerate the reduction in CH4 emissions in the medium term. For instance, support to accelerate the development of the biogas market from sustainable sources should have a positive effect by reducing emissions from manure management, provided that biogas facilities are well managed. Another key proposal is promoting best practices and technologies and improving herd housing management, feeding and breeding. Some CH4-related policies and measures are interlinked with the land use, land use change and forestry (LULUCF) sector, such as the link between cattle grazing and carbon sequestration in soils.
The EU common agricultural policy should also play an important role in reducing GHG emissions, including CH4. One of the 10 key objectives of the new policy for the period 2023-2027 is to contribute to climate change mitigation and adaptation, by means of reducing GHG emissions, enhancing carbon sequestration and promoting sustainable energy. Furthermore, with the European Green Deal, the environment and climate dimensions of agricultural policy are to be strengthened.
Finally, in 2022, the Commission adopted proposals for revised EU measures to address pollution from large industrial installations as part of the revision of the EU Industrial Emissions Directive. The key objectives are to progress towards a zero pollution environment in the EU and to support climate, energy and circular economy policies. The proposal includes CH4 from intensive rearing of livestock. For example, all cattle, pig and poultry farms with over 150 livestock units, which are responsible for 43% of CH4 emissions from livestock in the EU, would fall under the scope of the directive.
© Designed by Katie Rodriguez on unsplash.com
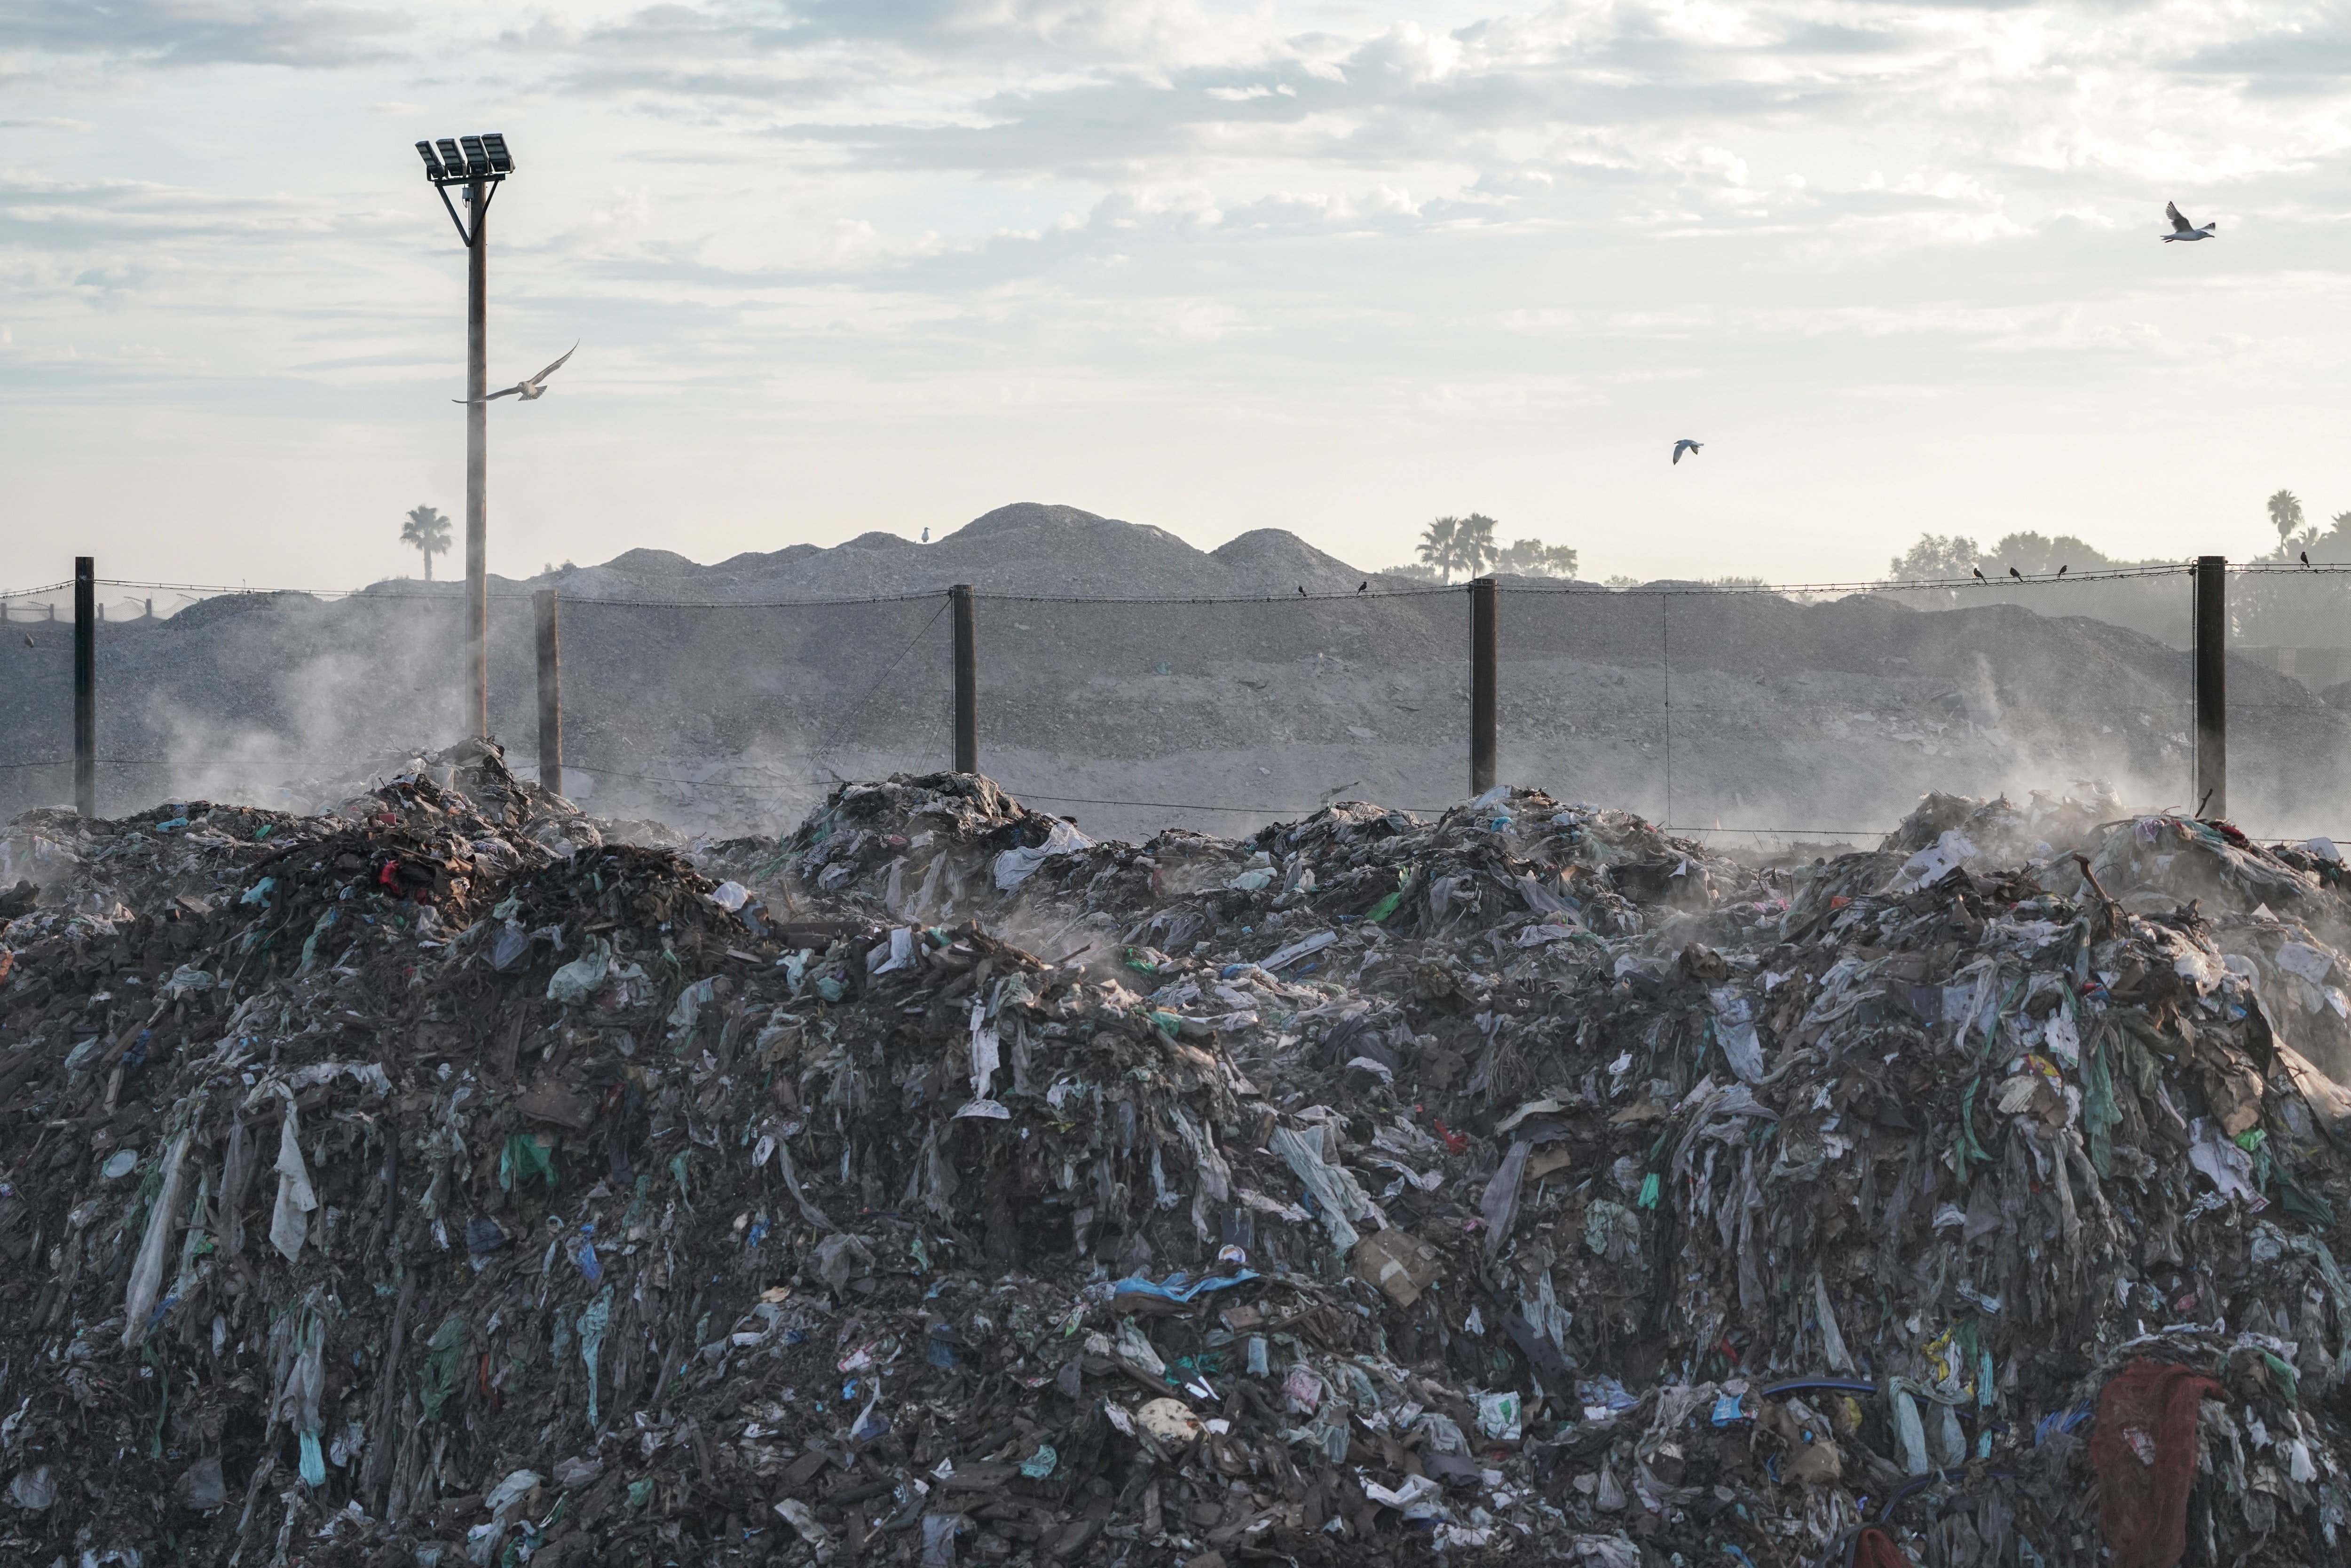
Methane in the waste sector in the EU
Based on the latest EU GHG inventory submission to the UNFCCC, the largest sources of methane (CH4) in the waste sector are solid waste disposal (80%), domestic and industrial wastewater treatment and discharge (15%) and, to a lesser extent, biological treatment of solid waste (4%). These three sources represented almost 100% of the 101Mt CH4 emissions in CO2e in the waste sector in 2020.
Emissions from solid waste disposal and wastewater treatment have decreased substantially since 1990 in the waste sector. The amount of municipal waste that is landfilled decreased strongly and other waste treatment methods, such as reusing and recycling, biological treatment of waste and waste incineration with energy recovery (for heat and electricity), have gained importance in EU Member States. The reductions in emissions are partly due to the early implementation of the EU Landfill Directive, which requires Member States to reduce the amount of untreated biodegradable waste disposed of in landfills and to install landfill gas recovery at all new sites. This has intensified separate collection, recycling and pre-treatment of waste, as well as landfill gas recovery by Member States, and led to significant reductions in CH4 emissions from solid waste disposal of biodegradable waste on land (Figure 6).
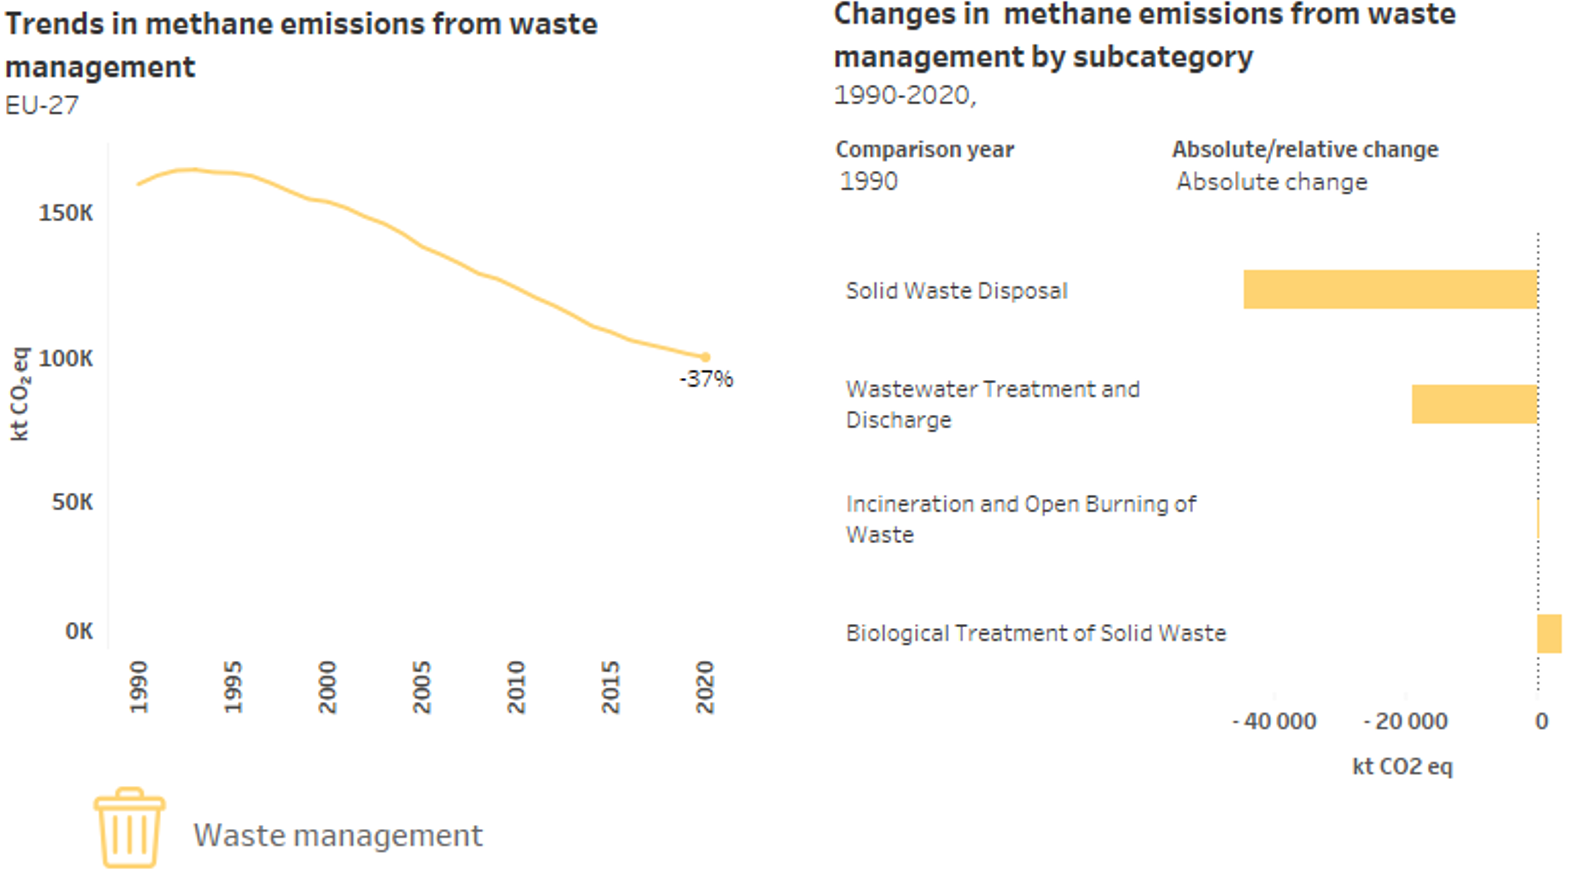
Source: EEA methane data viewer. More detailed greenhouse gas inventory data, including for other EEA member countries can be found in the EEA GHG data viewer.
GHG projections reported by Member States indicate that total CH4 emissions will continue decreasing, and at an even faster rate (-2.4% annually until 2030) than in the last 30 years since 1990.
In addition to the national binding targets from the EU Effort Sharing Regulation, the EU methane strategy also proposes several policies and measures to accelerate the reduction in CH4 emissions. These include reviews of the EU Landfill Directive, Urban Waste Water Treatment Directive and Sewage Sludge Directive.
The EU Landfill Directive, first adopted in 1999, introduces restrictions on landfilling of all waste suitable for recycling or other material or energy recovery, limits the share of municipal waste landfilled, and requires landfill operators to manage landfill gas by either using it for energy or flaring it. The directive was amended in 2018 to introduce an obligation to collect biodegradable waste separately by 2024 and set a new target of a maximum 10% landfilling of waste by 2035. CH4 emissions should decrease further as a result of these changes, and a new revision of the directive is anticipated in 2024. A Commission Communication setting out stronger enforcement of the waste legislation should also lead to additional reductions in CH4 emissions.
Finally, the Waste Framework Directive, which provides the legal framework at EU level for treating and managing waste, introduces a waste hierarchy for managing and preventing waste. This hierarchy includes, in order of priority, prevention, reuse, recycling, recovery and disposal. The waste hierarchy should encourage options that deliver the best overall environmental outcomes and has and will continue to result in substantial reductions in CH4 emissions in the EU.
International activities linked to methane
The increase in methane (CH4) concentrations is a global issue, and, although ambitious EU and Member States’ policies to curb CH4 emissions contribute to mitigating climate change, their impact alone will not be sufficient to avoid exceeding the 1.5°C global rise in temperature goal. This is because the EU accounts for only 7% of global greenhouse gas (GHG) emissions and for 4-5% of global CH4 emissions[9].
Several international activities are linked to global efforts to mitigate GHG emissions, including CH4 emissions.
- For example, the United Nations Framework Convention on Climate Change (UNFCCC), and its Kyoto Protocol, and the Paris Agreement provide a framework for reducing GHG emissions. The legally binding Paris Agreement is an international treaty adopted by 196 Parties to limit global warming to well below 2°C and make efforts to limit the temperature increase to 1.5°C, compared with pre-industrial levels. In their nationally determined contributions (NDCs), Parties to the Paris Agreement set out what action they will take to reduce their GHG emissions, and also actions to build resilience to adapt to the impacts of climate change. However, not all Parties include reductions in CH4 emissions as part of their current NDCs.
- The Paris Agreement also invites Parties to formulate and report long-term low-GHG emission development strategies; this was made more concrete at COP26 (the Climate Change Conference) in Glasgow by calling on Parties to transition to net zero emissions by or around mid-century. Countries were also invited to consider further opportunities to reduce non-carbon dioxide greenhouse gas emissions (CH4 being the largest). COP27 at Sharm El-Sheikh reiterated its invitation to Parties to consider further actions to reduce by 2030 non-carbon dioxide greenhouse gas emissions, including methane.
- Another key initiative is the Global Methane Pledge, which was launched at COP26 in Glasgow. Participating countries agree to take voluntary action to collectively reduce CH4 emissions by at least 30% by 2030 compared with 2020 levels. However, at the date of publication of this briefing, major CH4 polluters, such as China, India and Russia, are not part of this initiative.
- One of the key initiatives of the EU methane strategy is the establishment of satellite-based detection (Sentinel-5) of super-emitters through Europe’s Copernicus programme. It is expected that Copernicus will contribute to an EU coordinated capability for detecting and monitoring global super-emitters, which can support global efforts to mitigate CH4 emissions by guiding leak detection and repair.
- Another relevant initiative by the UN Environment Programme (UNEP) is the International Methane Emissions Observatory (IMEO). The observatory aims to reduce CH4 emissions by interlinking data on research, reporting and implementation, and to establish a global public record of verified CH4 emissions. It provides near-real-time data on the location and size of CH4 emissions that will support targeted mitigation actions.
- Finally, the Climate and Clean Air Coalition (CCAC) is a voluntary partnership of governments, intergovernmental organisations, scientific institutions, businesses and civil society with the aim of improving air quality and mitigating climate change through actions that reduce short-lived climate pollutants. The focus of these reductions is on CH4, black carbon and hydrofluorocarbons. This partnership is a good example of initiatives that aim to maximise the co-benefits of policies to reduce air pollution and mitigate climate change.
Notes
[1] For example, economic losses due to the impacts of ground-level ozone on wheat yields were EUR1,418 million across 35 European countries in 2019, due to production losses at national level of up to 9% of the yield; ‘Wheat yield loss in 2019 in Europe due to ozone exposure’, ETC/ATNI Report 17/2021, European Topic Centre on Air Pollution, Transport, Noise and Industrial Pollution (https://eionet.devel4cph.eea.europa.eu/etcs/etc-atni/products/etc-atni-report-17-2021-wheat-yield-loss-in-2019-in-europe-due-to-ozone-exposure)
[2] 2019 refinement to the 2006 IPCC guidelines for national GHG inventories, chemical industry emissions https://www.ipcc-nggip.iges.or.jp/public/2019rf/pdf/3_Volume3/19R_V3_Ch03_Chemical_Industry.pdf
[3] The geographical scope of the EU 2022 submission to the UNFCCC includes, in addition to EU Member States, the United Kingdom (EU Convention reporting) and Iceland plus the United Kingdom (EU Kyoto Protocol reporting). The description of key emission sources in the energy, agriculture and waste sectors in this briefing is based on and consistent with the EU inventory submission but includes only emissions pertaining to the EU-27, unless otherwise stated.
[4] According to GHG inventory guidelines, recalculations may be needed to improve emission (and removal) estimates due to the availability of better methods, activity data or emission factors, and to ensure time series consistency. Thus, countries may change their estimation methods to improve the quality of their reported emissions and removals. Changes in methodology should be time series consistent and therefore should not introduce a bias in the reported trends for any given inventory submission. However, the percentage shares and percentage emission trends may be affected significantly by these recalculations.
[5] EU GHG inventory submission to UNFCCC, 2022, based on the GHG inventory submissions of its Member States as part of the EU Governance Regulation, and noting that Member States’ submissions to the UNFCCC are also part of the EU’s submission (UNFCCC, 2022b).
[6] Current projections of GHG emissions precede the adoption of the European Climate Law, and the EU’s ‘Fit for 55’ and REPowerEU proposals. Therefore, these recent policy proposals are not fully reflected in national and EU projections.
[7] The aim of the CH4 transparency database will be to use such data to establish the CH4 intensity profile of countries and companies, which will serve as a source of information for EU dialogues with partner countries, for the purchasing decisions of importers of fossil fuel energy to the EU and for other stakeholders and the wider public. These profiles will be publicly available and regularly updated to form an evidence-based assessment of the level of commitment of companies and countries to reducing their CH4 emissions.
[8] Milk quotas were agreed at the European Council in the mid-1980s to address the structural oversupply of milk in the EU. In the previous system, dairy farmers were guaranteed a price for their milk regardless of market demand, which led to oversupply in the EU and also had a negative impact on world prices. The regime changed and a quota was fixed for individual producers together with a levy should the quota be exceeded.
[9] Based on global emission estimates from the World Bank and Climate Watch. EU emissions are as reported in the latest GHG inventory submission to UNFCCC.
References
The list of references is not exhaustive of the sources of data and information used in the briefing, but all sources should be included in the main text.
Danish Energy Agency, 2022, ‘The possible climate effects of the gas leaks from the Nord Stream 1 and 2 pipelines’, press release, 29 September (https://ens.dk/en/press/possible-climate-effect-gas-leaks-nord-stream-1-and-nord-stream-2-pipelines) accessed 2 November 2022.
Dinneen, J., 2022, ‘Nord Stream leak may have been largest methane emission ever recorded’, New Scientist, 11 October (https://www.newscientist.com/article/2342081-nord-stream-leak-may-have-been-largest-methane-emission-ever-recorded/) accessed 2 November 2022.
EEA, 2019, The European environment — state and outlook 2020: knowledge for transition to a sustainable Europe, European Environment Agency (https://www.eea.europa.eu/publications/soer-2020/chapter-08_soer2020-air-pollution/view) accessed 2 November 2022.
EEA, 2022a,Air quality in Europe 2022 — health impacts of air pollution in Europe, European Environment Agency (forthcoming).
EEA, 2022b, ‘Trends and projections in Europe 2022’, European Environment Agency (https://www.eea.europa.eu/highlights/trends-and-projections-limited-rebound) accessed 2 November 2022.
EEA, 2022c, Annual European Union greenhouse gas inventory 1990-2020 and inventory report 2022. Submission to the UNFCCC, European Environment Agency (https://www.eea.europa.eu/publications/annual-european-union-greenhouse-gas-1) accessed 2 November 2022.
IEA, 2022, ‘Global Methane Tracker 2022’, International Energy Agency (https://www.iea.org/reports/global-methane-tracker-2022) accessed 2 November 2022.
IPCC, 2021, ‘Summary for policymakers’, in: Climate change 2021: the physical science basis. Contribution of Working Group I to the sixth assessment report of the Intergovernmental Panel on Climate Change(https://www.ipcc.ch/report/ar6/wg1/downloads/report/IPCC_AR6_WGI_SPM.pdf) accessed 2 November 2022.
UNFCCC, 2017, European Union. Biennial reports 3. National communication 7, United Nations Framework Convention on Climate Change (https://unfccc.int/documents/198246) accessed 2 November 2022.
UNFCCC, 2022, ‘National inventory submissions 2022’, United Nations Framework Convention on Climate Change (https://unfccc.int/ghg-inventories-annex-i-parties/2022) accessed 2 November 2022.
UNFCCC, 2022b, European Union. 2022 National inventory report, United Nations Framework Convention on Climate Change (https://unfccc.int/documents/461931) accessed 2 November 2022.
Identifiers
Briefing no. 21/2022
Title: Methane emissions in the EU: the key to immediate action on climate change
EN HTML: TH-AM-22-021-EN-Q - ISBN: 978-92-9480-510-2 - ISSN: 2467-3196 - doi: 10.2800/078132
EN PDF: TH-AM-22-021-EN-N - ISBN: 978-92-9480-509-6 - ISSN: 2467-3196 - doi: 10.2800/7532

Document Actions
Share with others