The EU’s ambition to double the circular use of materials
The circular economy action plan states that the EU needs to ‘advance towards keeping its resource consumption within planetary boundaries, and therefore strive to reduce its consumption footprint and double its circular material use rate in the coming decade’ (EC, 2020a).
In this briefing, doubling the circular material use rate (CMUR) within the next decade is understood as increasing the CMUR of the EU-27 as a whole from 11.7%, as in 2020 — when the action plan was adopted — to 23.4% by 2030.
Trends in the circular material use rate
The CMUR measures an economy’s circularity as the share of recycled waste in the total input of materials into the economy. These materials consist of new materials (measured as domestic material consumption) and recycled waste. High CMUR values indicate that much of the material needs of an economy are met by using recycled waste.
In 2021, the CMUR was 11.7% in the EU-27 (Figure 1). This means that, of the 7.2 billion tonnes of materials used in the EU economy, 11.7% were recycled waste[1]. The CMUR increased by 3.4 percentage points between 2004 and 2021; however, progress has slowed since 2010. Of all materials used, the CMUR is highest for metal ores and lowest for fossil fuels.
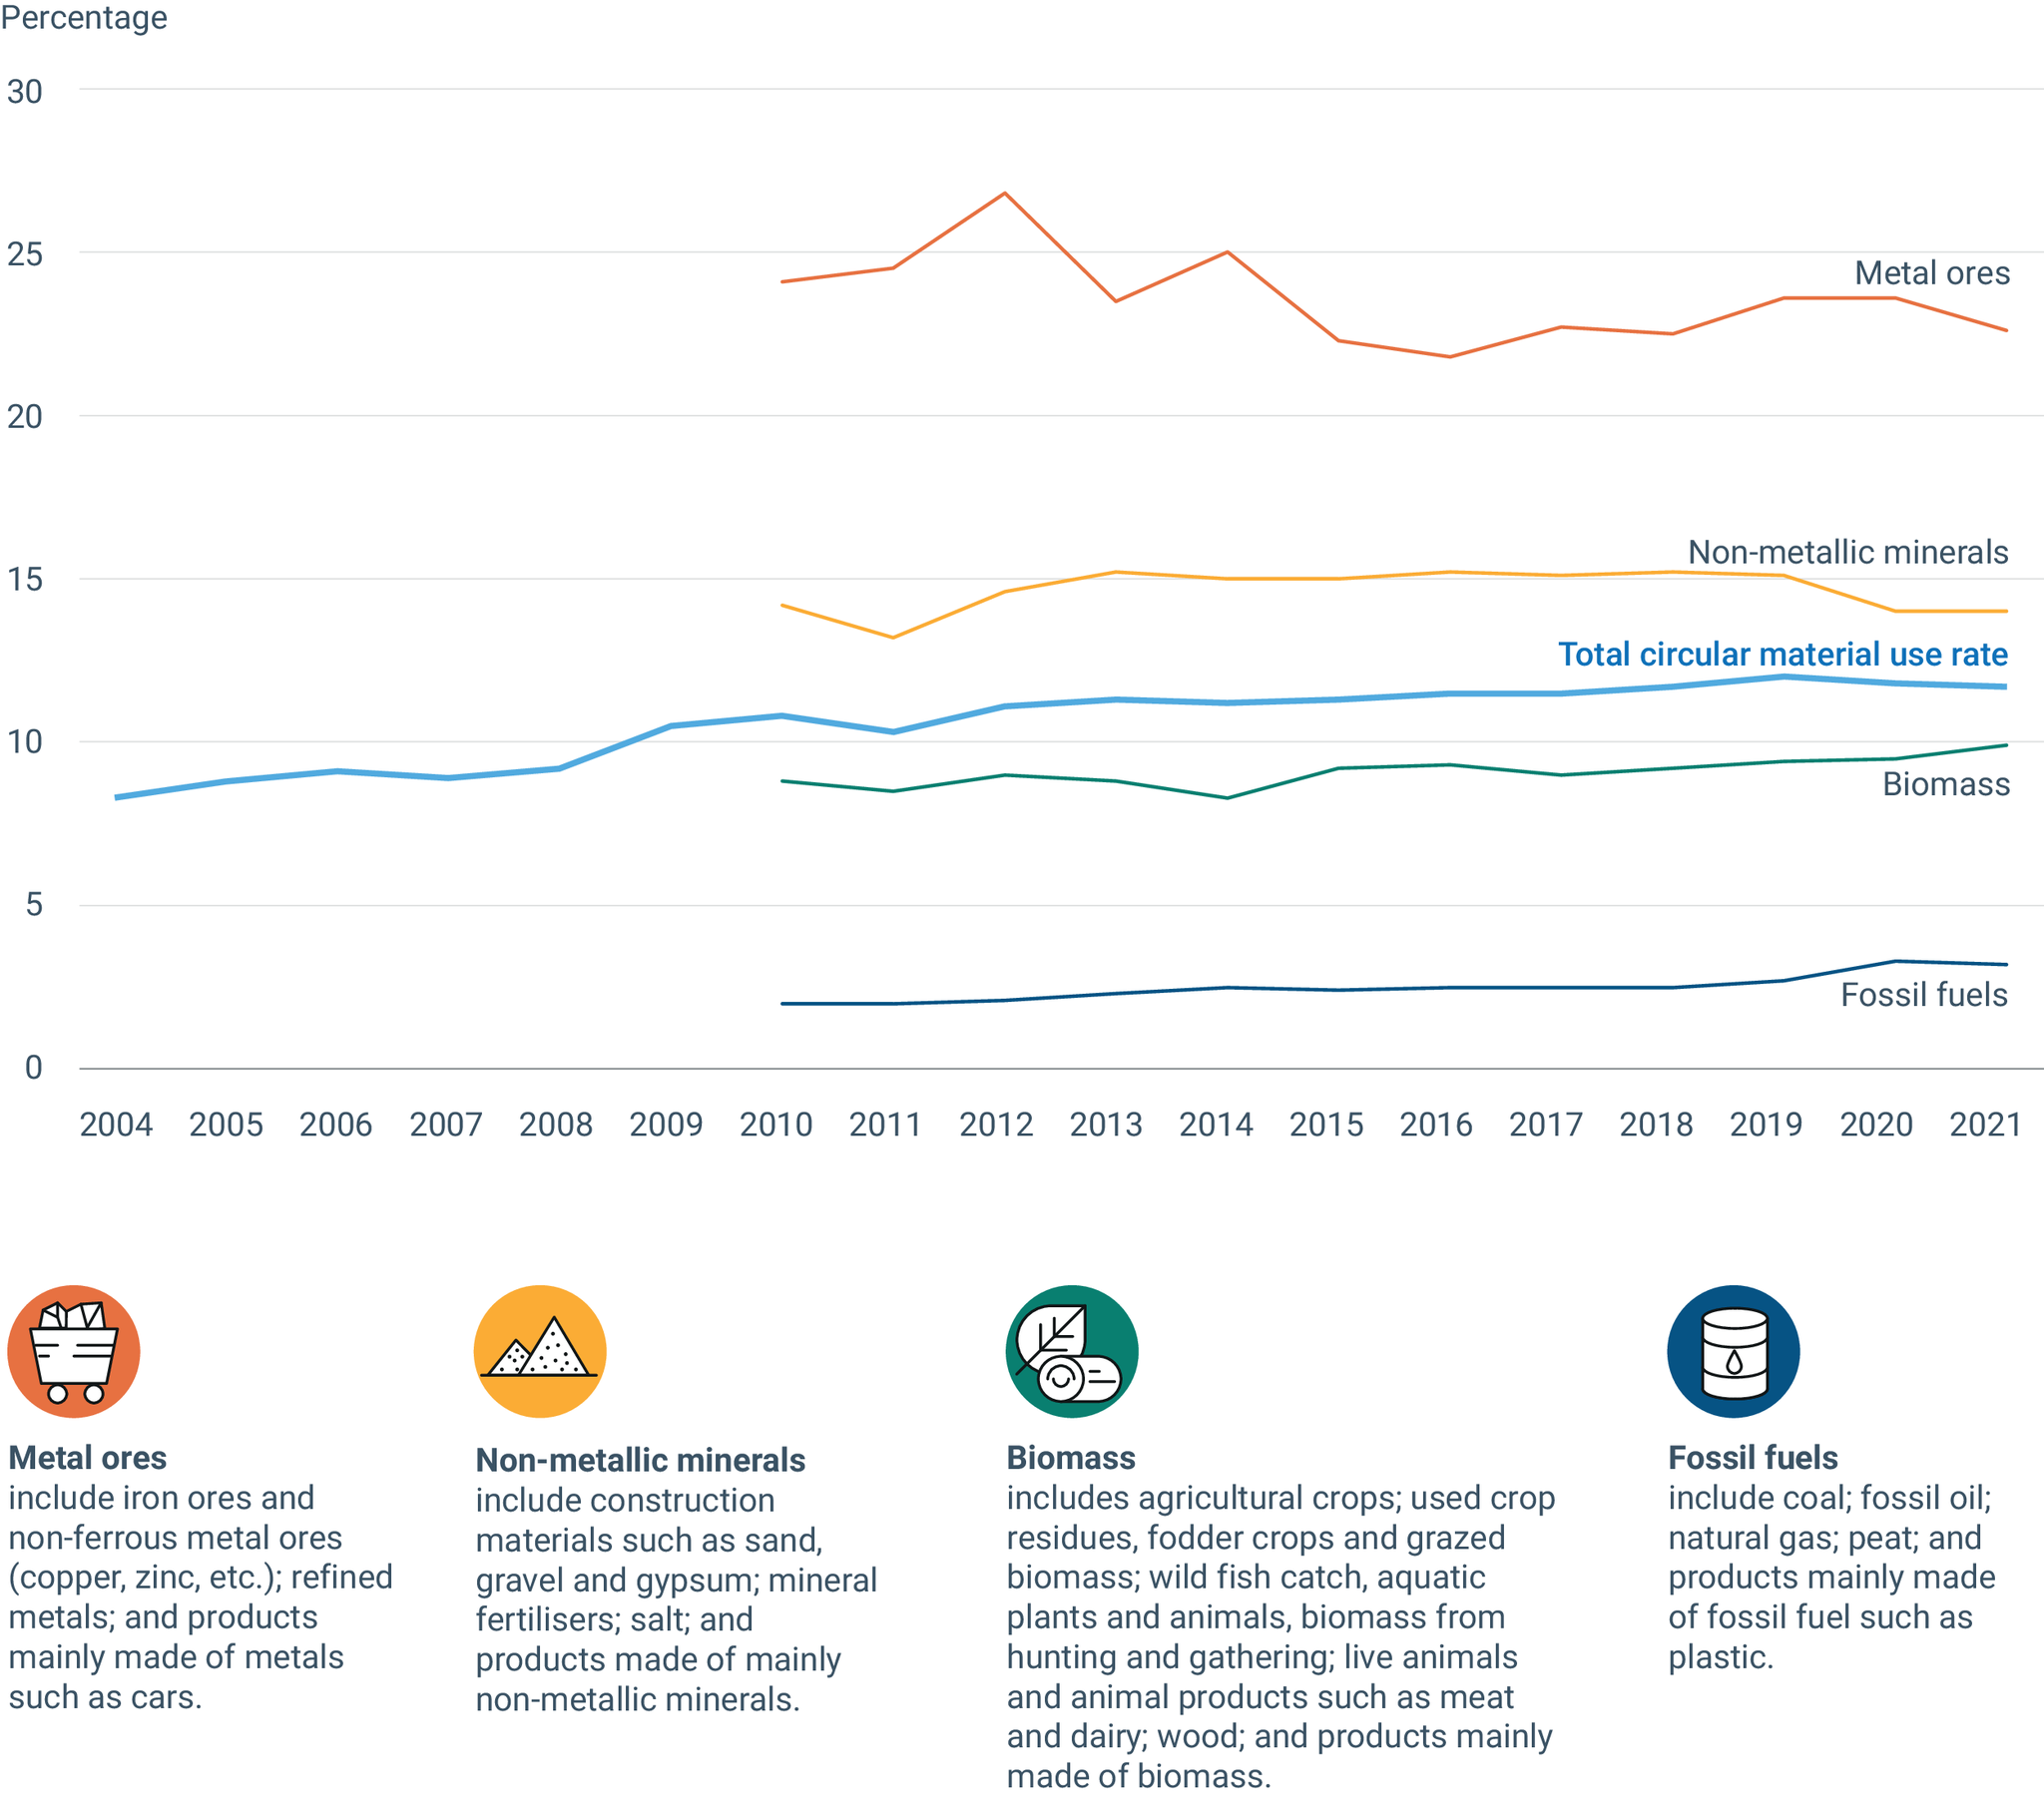
Note: No breakdown by material category available for 2004-2009.
Sources: Eurostat (2018, 2023a).
Explore different chart formats and data here
Main factors influencing the circular material use rate
The amount of new materials used in the economy (measured as domestic material consumption) is about eight times higher than the amount of recycled materials used; therefore, the CMUR is influenced more by trends in material consumption than by trends in recycling. In fact, the CMUR trend is, to a large extent, inversely proportional to trends in material use (Figure 2).
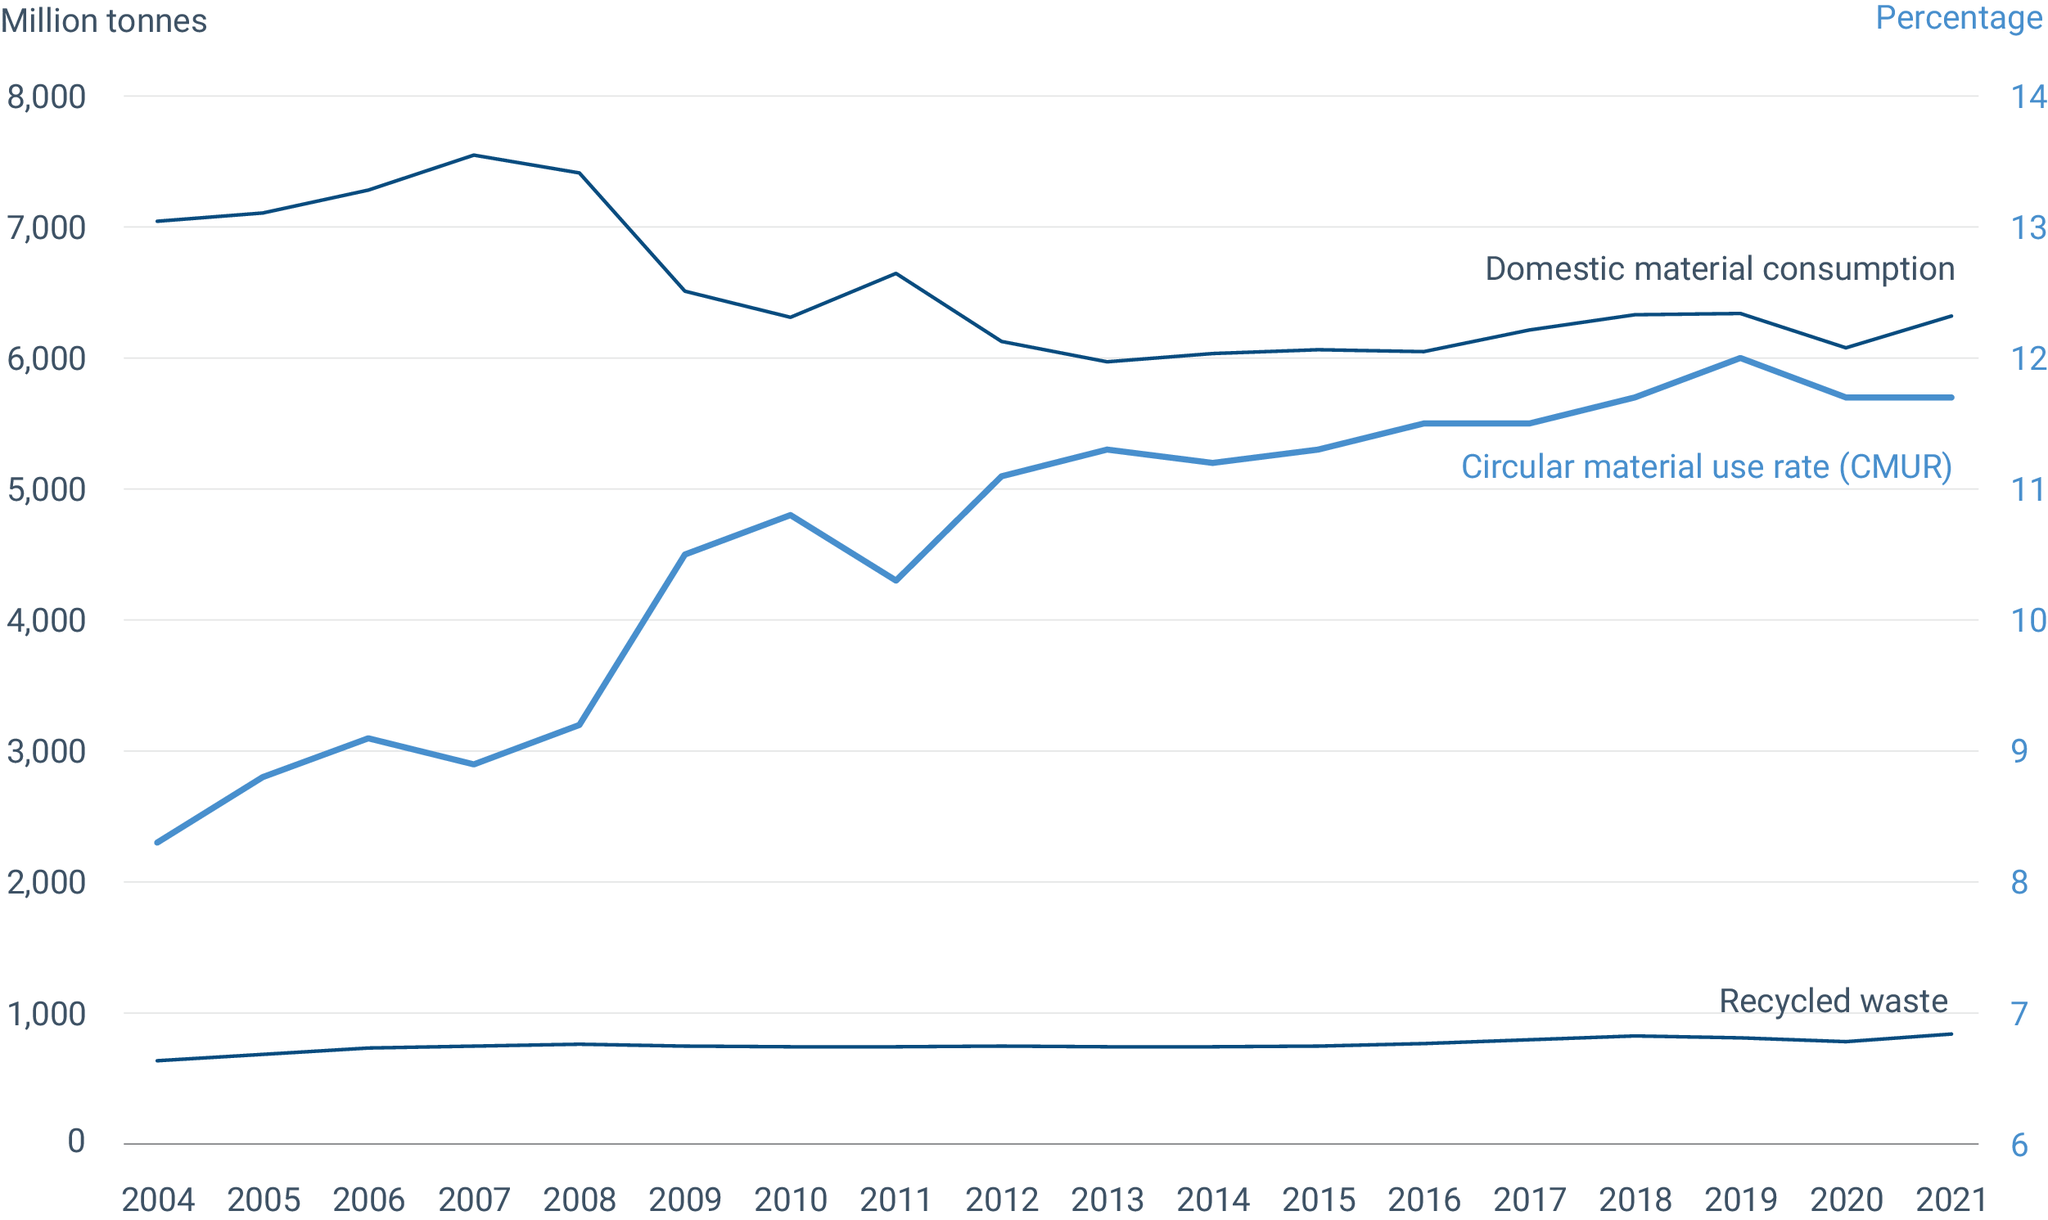
Note: Missing data for odd years for recycled waste are linearly interpolated.
Sources: CMUR: Eurostat (2023a); recycled waste: calculation by the European Topic Centre on Circular Economy and Resource Use using Eurostat (2023b,c); domestic material consumption Eurostat (2022).
Explore different chart formats and data here
Nevertheless, the increase in the CMUR from 10.8% in 2010 to 11.7% in 2021 was mainly due to an increase in the amount of recycled waste being fed back into the economy, as domestic material consumption bounced back to the 2010 level in 2021. Non-metallic minerals such as construction materials account for on average 53% of materials used. Biomass and fossil fuels account for less than a quarter of material consumption on average, each on a tonnage basis, and metal ores account for only about 6%. The consumption of fossil fuels decreased between 2010 and 2021, but this was counterbalanced by an increase in the consumption of non-metallic minerals, biomass and metal ores. On the other hand, recycled waste increased for all materials, but most for non-metallic minerals, which made up two thirds of all recycled waste.
Prospects for the EU reaching its target of doubling the circular material use rate by 2030
Doubling the CMUR (from 11.7% in 2020 to 23.4% in 2030) will require an increase of 1.3 percentage points each year on average. However, the CMUR increased by only 0.4 percentage points annually in the period 2004-2010 and even less — by 0.1 percentage points annually — over the past decade. Thus, to reach the target, the pace of change will need to increase dramatically, which will be very challenging.
The CMUR can be increased by reducing the amount of (raw) materials consumed domestically by the EU economy (through reduced consumption and/or improved resource efficiency) or ramping up recycling, or a combination of both.
Design for circularity can contribute to both reducing virgin material use and increasing recycling, and can thereby increase the CMUR. Recent policy proposals — such as for an ecodesign for sustainable products regulation (EC, 2022a), a batteries regulation (EC, 2020b) and a packaging and packaging waste regulation (EC, 2022b) — increasingly include requirements on and/or aim to incentivise design for circularity.
To increase the CMUR, different approaches are needed for fossil fuels and biomass, on the one hand, and for metal ores and non-metallic minerals, on the other. Metal ores have the highest CMUR of all materials, as they are economically attractive to recycle. Metal ores and non-metallic minerals largely add to material stocks such as buildings and infrastructure, as well as other materials with shorter life spans, thereby becoming available for recycling at different points in time.
Approaches for increasing the CMUR of metal ores and non-metallic minerals should aim to both reduce their input into the economy (e.g. by increasing the usable lifetime of products and materials) and increase their rate of recycling when they become waste. For instance, increasing the recycling of construction and demolition waste or the more intensive use of buildings and infrastructure could significantly alter the CMUR of metal ores and non-metallic minerals.
Fossil fuels and biomass are largely converted into emissions, as most of these materials are used for energy generation or as food, and therefore recycling options are limited. This means that increasing the CMUR of these materials can be achieved by reducing the use of fossil fuels use for energy purposes and replacing them with renewable energy technologies, and by reducing food waste.
The circular economy action plan includes a number of actions that aim to increase recycling and contribute to reducing material use, for example through extending the lifetime of products. In addition, the EU aims to achieve climate neutrality by 2050 and reduce net greenhouse gas emissions by at least 55% compared with 1990 levels by 2030 by implementing the ‘Fit for 55’ package (EC, 2021). While reaching these targets will require a reduction in the amount of fossil fuels used in the economy, it will also lead to more biomass being used as a fossil fuel substitute in many economic sectors (EEA, forthcoming).
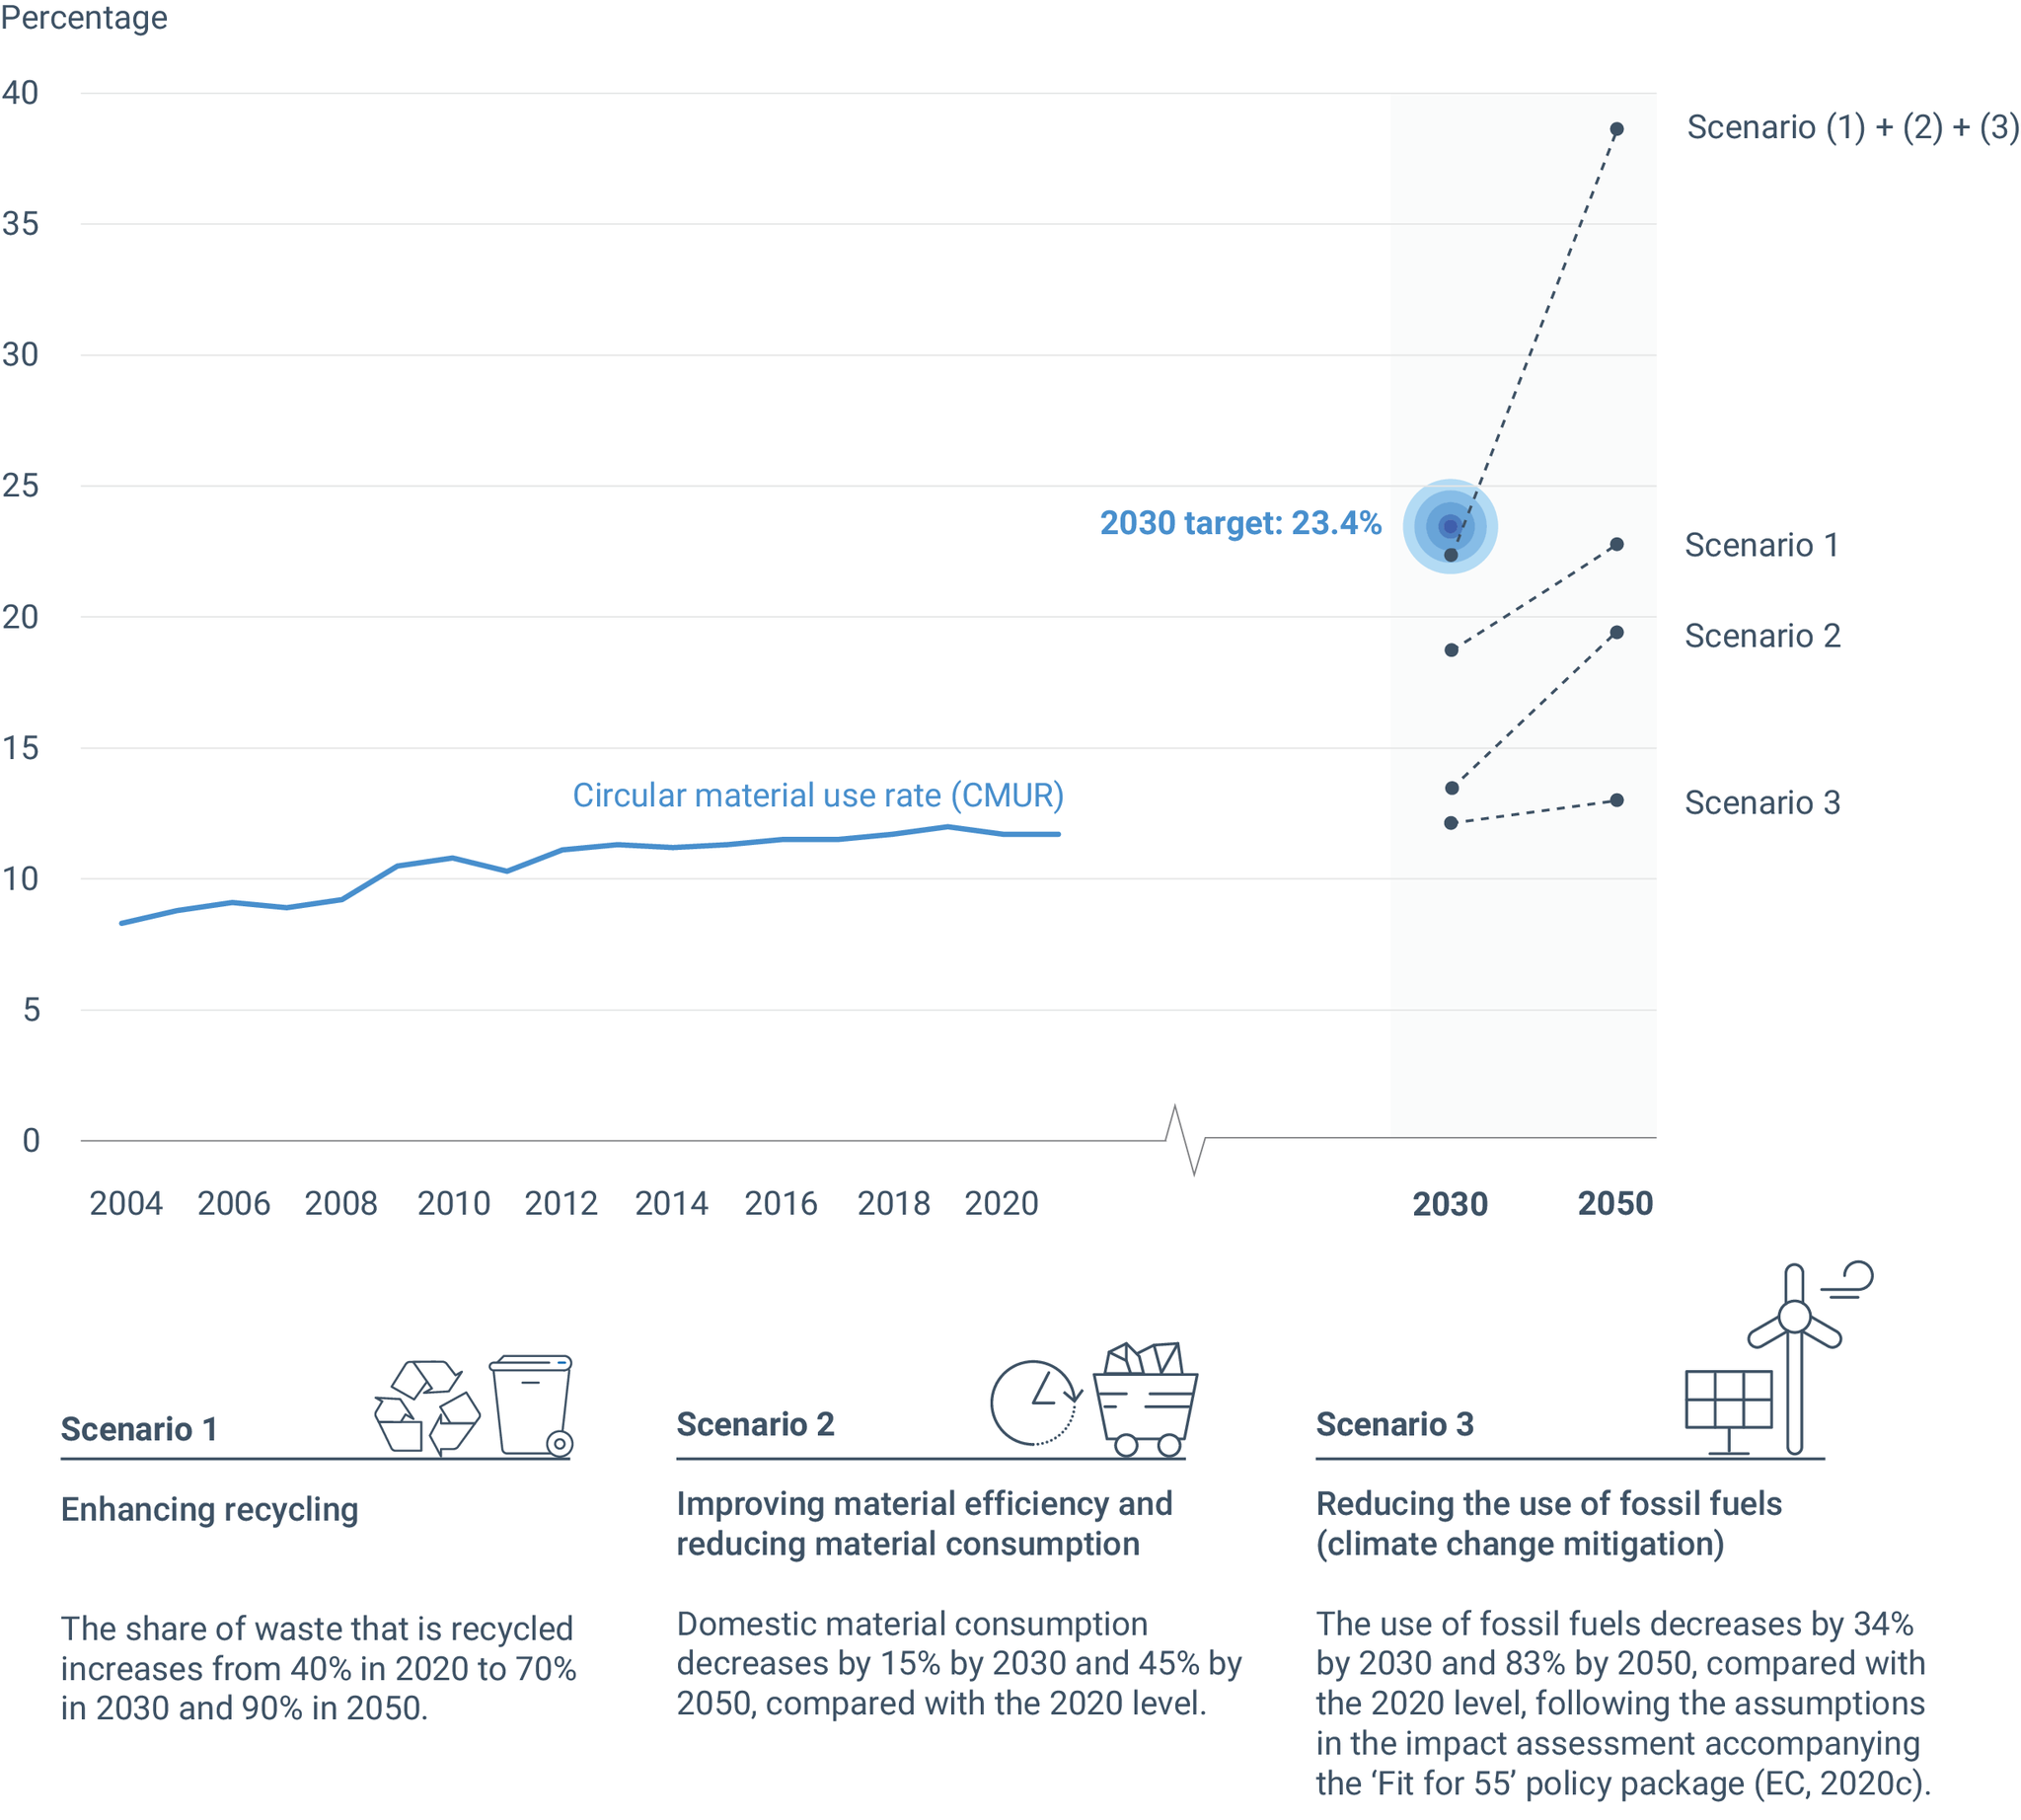
So, how can we achieve the CMUR doubling target? In this briefing, several scenarios are explored using a simplified methodology that translates the actions of the circular economy and climate policy frameworks into assumptions related to the components of the CMUR, with a 2030 perspective and a 2050 perspective (Figure 3):
- Scenario 1: enhancing recycling— the share of waste that is recycled increases from 40% in 2020 to 70% in 2030 and 90% in 2050.
- Scenario 2: improving material efficiency and reducing material consumption — domestic material consumption decreases by 15% by 2030 and 45% by 2050, compared with the 2020 level.
- Scenario 3: reducing the use of fossil fuels (climate change mitigation) — the use of fossil fuels decreases by 34% by 2030 and 83% by 2050, compared with the 2020 level[2], following the assumptions in the impact assessment accompanying the ‘Fit for 55’ policy package (EC, 2020c).
- A combination of scenarios 1, 2 and 3.
This simplified scenario exploration indicates that none of the scenarios alone would achieve the target of doubling the CMUR by 2030; however, increasing recycling to the very high rate of 90% of all waste could enable the EU to almost meet the target by 2050.
By 2030, the CMUR could increase to 22% — very close to the 2030 target — if different strategies are combined (e.g. increasing the recycling of all treated waste to 70%, decreasing material inputs into the economy by 15% and reducing the amount of fossil fuels used by 34%). Achieving the ambition of doubling the CMUR by 2030 would thus require the implementation of a combination of the above changes within a short time period. This would require coordinated efforts in different policy areas, including in the circular economy and climate policy areas. Enhancing waste recycling alone will not be sufficient for the EU to double its CMUR by 2030.
Note: The analysis of the changes to waste and material flows provides only a first indicative estimate of how the CMUR might change (assuming other parameters remain constant), without implementing a full mass-balancing exercise. The effect of selected (isolated) variations in the underlying parameters of the CMUR indicator should be interpreted as exploratory scenario results.
Sources: Developed by the EEA and the European Topic Centre on Circular Economy and Resource Use (ETC CE). A more detailed description of the scenarios and how they are modelled is available in ETC CE (2023). CMUR trend 2004-2021: Eurostat (2023a).
Explore different chart formats and data here
The circular material use rate from the perspective of environmental impacts
The CMUR is a macro-level, mass-flow indicator that is very useful for understanding the circularity of the EU’s economy. However, it is based on all materials and does not reflect the fact that different types of materials have different environmental impacts. Combining knowledge about the circularity and the environmental impacts of different materials can therefore support policymaking that enables the more sustainable use of materials and achieves a net reduction in impacts.
From a material use perspective, non-metallic minerals account for around half of all materials used in the economy, followed by biomass, fossil fuels and metal ores. From an environmental impacts perspective, the picture is considerably different. Fossil fuels account for 35% of the environmental footprint[3] of ready-to-use materials, biomass accounts for 32%, metals for 26% and non-metallic minerals for only 6% (Figure 4). The environmental impacts of biomass are mainly generated during the production phase (ETC CE, 2023).
The environmental footprint of materials refers to the environmental impacts of the extraction and processing of materials that are ready to use in industry (e.g. steel or meat). Such ready-to-use materials account for 76% of the total environmental footprint of EU consumption, while the rest of the economy and household activities account for the remainder (EEA, 2022).
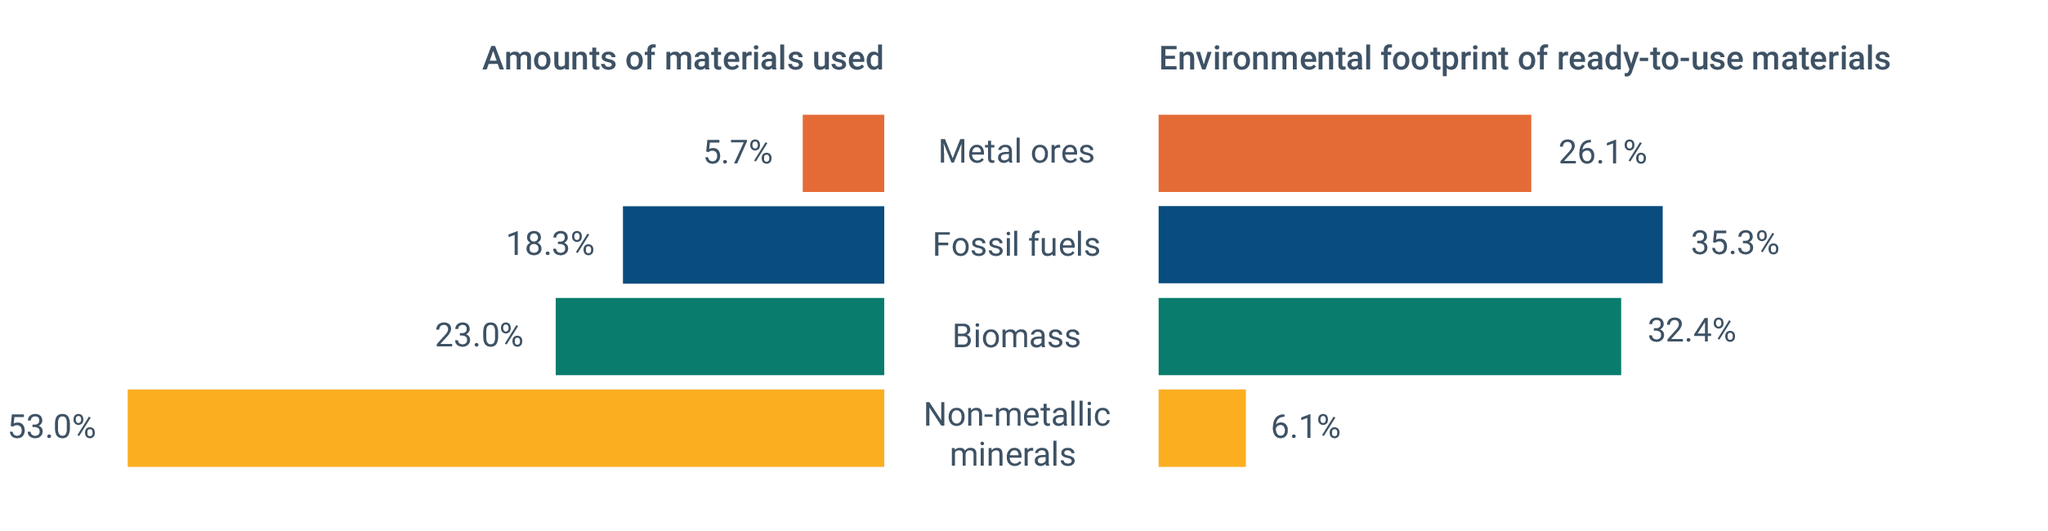
Sources: Amounts of materials used (measured as domestic material consumption): Eurostat (2022); environmental footprint of ready-to-use materials: ETC CE (2023), calculated using Exiobase version 3.8.2.
Explore different chart formats and data here
These results highlight that, from an environmental perspective, more focus needs to be put on fossil fuels and biomass products. It is remarkable that these materials, responsible for the highest environmental impacts associated with the production of materials consumed in the EU, are those with the lowest CMURs simply because they are used mainly for energy purposes or as food.
While the environmental footprint of ready-to-use materials can be reduced by decreasing their consumption and increasing their circular use, it can also be reduced by decreasing the environmental impacts per tonne of material during extraction/cultivation e.g. through improving management practices and in processing.
Notes
[1] The amount of recycled waste is approximated by the amount of waste recycled in domestic recovery plants minus imported waste destined for recovery plus exported waste destined for recovery abroad (EEA, 2023).
[2] The European Commission published several ‘Fit for 55’ scenarios highlighting final energy demand by fuel type in 2030 (EC, 2021). These scenarios assume a reduction in fossil fuel use by 36-39% by 2030 and 84-85% by 2050 from a 2015 baseline. While these figures cannot directly be translated into the categories for fossil fuels in the material flow accounts, it was decided to approximate the reduction in the use of fossil fuels in the scenario analysis for this briefing by re-calculating the reductions from a 2020 baseline and using the assumed reductions in fossil fuel use for the ‘ALLBNK’ scenario (the most ambitious one of the scenarios). The increased demand for biomass and materials for building up renewable energy technology/infrastructure is not taken into account, as this would require more detailed scenario building.
[3] The environmental footprint of consumption can be calculated through different methodologies, depending on the scope and objective of the calculations. The methodology used in this briefing is described in ETC CE (2023).
References
EC, 2020a, Communication from the Commission to the European Parliament, the Council, the Economic and Social Committee and the Committee of the Regions ‘A new circular economy action plan for a cleaner and more competitive Europe’ (COM(2020) 98 final of 11 March 2020).
EC, 2020b, Proposal for a Regulation of the European Parliament and of the Council concerning batteries and waste batteries, repealing Directive 2006/66/EC and amending Regulation (EU) No 2019/1020 (COM(2020) 798 final of 10 December 2020).
EC, 2020c, Commission staff working document — Impact assessment accompanying the document Communication from the Commission to the European Parliament, the Council, the European Economic and Social Committee and the Committee of the Regions ‘Stepping up Europe’s 2030 climate ambition, Investing in a climate-neutral future for the benefit of our people (SWD(2020) 176 final of 17 September 2020).
EC, 2021, Communication from the Commission to the European Parliament, the Council, the European Economic and Social Committee and the Committee of the Regions ‘“Fit for 55”: delivering the EU’s 2030 Climate Target on the way to climate neutrality’ (COM(2021) 550 final of 14 July 2021).
EC, 2022a, Proposal for a Regulation of the European Parliament and of the Council on establishing a framework for setting ecodesign requirements for sustainable products and repealing Directive 2009/125/EC (COM(2022) 142 final of 30 March 2022).
EC, 2022b, Proposal for a Regulation of the European Parliament and of the Council on packaging and packaging waste, amending Regulation (EU) 2019/1020 and Directive (EU) 2019/904, and repealing Directive 94/62/EC (COM(2022) 677 final of 30 November 2022).
EEA, 2022, ‘The EU Consumption Footprint (top-down approach)’, European Environment Agency (Europe’s consumption footprint (europa.eu)) accessed 26 January 2023.
EEA, 2023, ‘Circular material use rate in Europe’, European Environment Agency (https://www.eea.europa.eu/ims/circular-material-use-rate-in-europe) accessed 12 April 2023.
EEA, forthcoming, The European biomass puzzle, European Environment Agency.
ETC CE, 2023, Analysis of the circular material use rate and the doubling target, European Topic Centre on Circular Economy and Resource Use (https://www.eionet.europa.eu/etcs/etc-ce/products/etc-ce-report-2023-6-analysis-of-the-circular-material-use-rate-and-the-doubling-target), accessed 4 May 2023.
Eurostat, 2018, Economy-wide material flow accounts — handbook: 2018 edition, Publications Office of the European Union, Luxembourg.
Eurostat, 2022, ‘Material flow accounts (env_ac_mfa)’, Eurostat Data Browser (https://ec.europa.eu/eurostat/databrowser/view/env_ac_mfa/default/table?lang=en) accessed 5 February 2023.
Eurostat, 2023a, ‘Circular material use rate by material type (env_ac_curm)’, Eurostat Data Browser (https://ec.europa.eu/eurostat/databrowser/view/ENV_AC_CURM__custom_4598637/default/table?lang=en) accessed 5 February 2023.
Eurostat, 2023b, ‘Treatment of waste by waste category, hazardousness and waste management operations (env_wastrt)’, Eurostat Data Browser (https://ec.europa.eu/eurostat/databrowser/view/env_wastrt/default/table?lang=en) accessed 5 February 2023.
Eurostat, 2023c, ‘Material flows for circular economy — Sankey diagram data (env_ac_sd)’, Eurostat Data Browser (https://ec.europa.eu/eurostat/databrowser/view/env_ac_sd/default/table?lang=en) accessed 20 February 2023.
Identifiers
Briefing no. 08/2023
Title: How far is Europe from reaching its ambition to double the circular use of materials?
EN HTML: TH-AM-23-008-EN-Q - ISBN: 978-92-9480-564-5 - ISSN: 2467-3196 - doi: 10.2800/69671
EN PDF: TH-AM-23-008-EN-N - ISBN: 978-92-9480-561-4 - ISSN: 2467-3196 - doi: 10.2800/599752

Document Actions
Share with others