|
Indicator
|
Indicator
past trend
|
Selected objective to be met by 2020
|
Indicative outlook of the EU meeting the selected objective by 2020
|
|
Land take
|
EU

|
EEA
|
Keep the rate of land take below 800 km2 on average per year from 2000–2020 in order to keep on track to achieve the aim of no net land take by 2050 — Resource Efficiency Roadmap
|

|
|
The EU annual average land take from 2000–2012 was above the 800-km2 milestone. Nevertheless the average annual land take in 2006–2012 was less than in 2000–2006. It is uncertain if a further reduction will take place and at what rate
|
For further information on the scoreboard methodology please see Box I.1 in the EEA Environmental indicator report 2016
Setting the Scene
The 7th EAP includes an objective that land is managed sustainably, and promotes the objective of no net land take by 2050 (EU, 2013). Agricultural land and, to a lesser extent, forests and other semi-natural and natural areas are lost to the development of buildings and other artificial surfaces. This leads to loss of fertile land and affects biodiversity, as it decreases habitats, the living space of important species, and fragments the landscapes that support and connect them. Land occupied by man-made surfaces and dense infrastructure is also a significant source of water, soil and air pollution. The sealing of land by these surfaces can also negatively impact the water balance and increase the frequency and intensity of flooding. Land take is also a matter of land use efficiency and an aspect of a wider land degradation issue, addressed by the United Nations (UN) Sustainable Development Goals, particularly goal 15.3 on land.
Policy targets and progress
There is no specific objective in the environmental acquis that matches the 7th EAP objective of sustainable land management, and promotion of no net land take by 2050. However, the Roadmap to a Resource Efficient Europe (EC, 2011) states that ‘if we are to reach the state of no net land take by 2050, following a linear path, we would need to reduce land take to an average of 800 km2 per year (for the EU) in the period 2000–2020’. This average figure is used in this briefing as the benchmark to assess progress. In the 2000–2012 period, for the EU the estimated average annual land take was 888 km2 (EEA, 2016), which is considerably above the level required to achieve the long-term objective of ‘no net land take’. However, estimated average annual land take has decreased from 930 km2 per year in the 2000–2006 period to 845km2 per year in the subsequent 2006–2012 period (EEA, 2016).
Based on the average for the EU-28, 52 % of all areas that changed to artificial surfaces were arable land or permanent crops in 2006 (47 % for the EEA-33) (Figure 1). Pastures and mixed farmland were, on average, the category of land that was the next most taken, representing 26 % of the total (27 % for the EEA-33), while forests and transitional woodland shrub made up 14 % (16 % for the EEA-33). As these land cover types are substituted to varying degrees by impervious cover, the provision of important services provided by soils, such as storing and filtering water, and the transformation of nutrients and contaminants deteriorates. This specific issue is discussed in more detail in the soil section of the recent SOER 2015 (The European environment — State and outlook 2015; EEA, 2015).
From the perspective of the types of development that occur on the land that is taken, at the EU level the largest area, 32 %, was taken by construction sites between 2006 and 2012. These sites represent transitional areas that will turn into some form of urban development in the future. The second largest area, 23 %, was taken for industrial and commercial sites. Housing, services and recreation made up 20 % of the overall increase in urban and other artificial areas. The proportion of newly created mines, quarries and dumpsites was 18 % in the EU-28. Although land take for transport infrastructures is underestimated in the Corine Land Cover dataset, it still covered 7 % of the area taken. A similar pattern emerges when looking at all 33 EEA member countries (EEA, 2016).
Land use in Europe is shaped by the links between economic activity, increased mobility and growth in transport infrastructure and a number of other drivers, such as the increasing demand for living space per person. Regional urbanisation rates vary substantially, with coastal and mountainous regions among the most affected because of the increasing demand for artificial surfaces related to transport, recreation and leisure in these areas (see Figure 2).
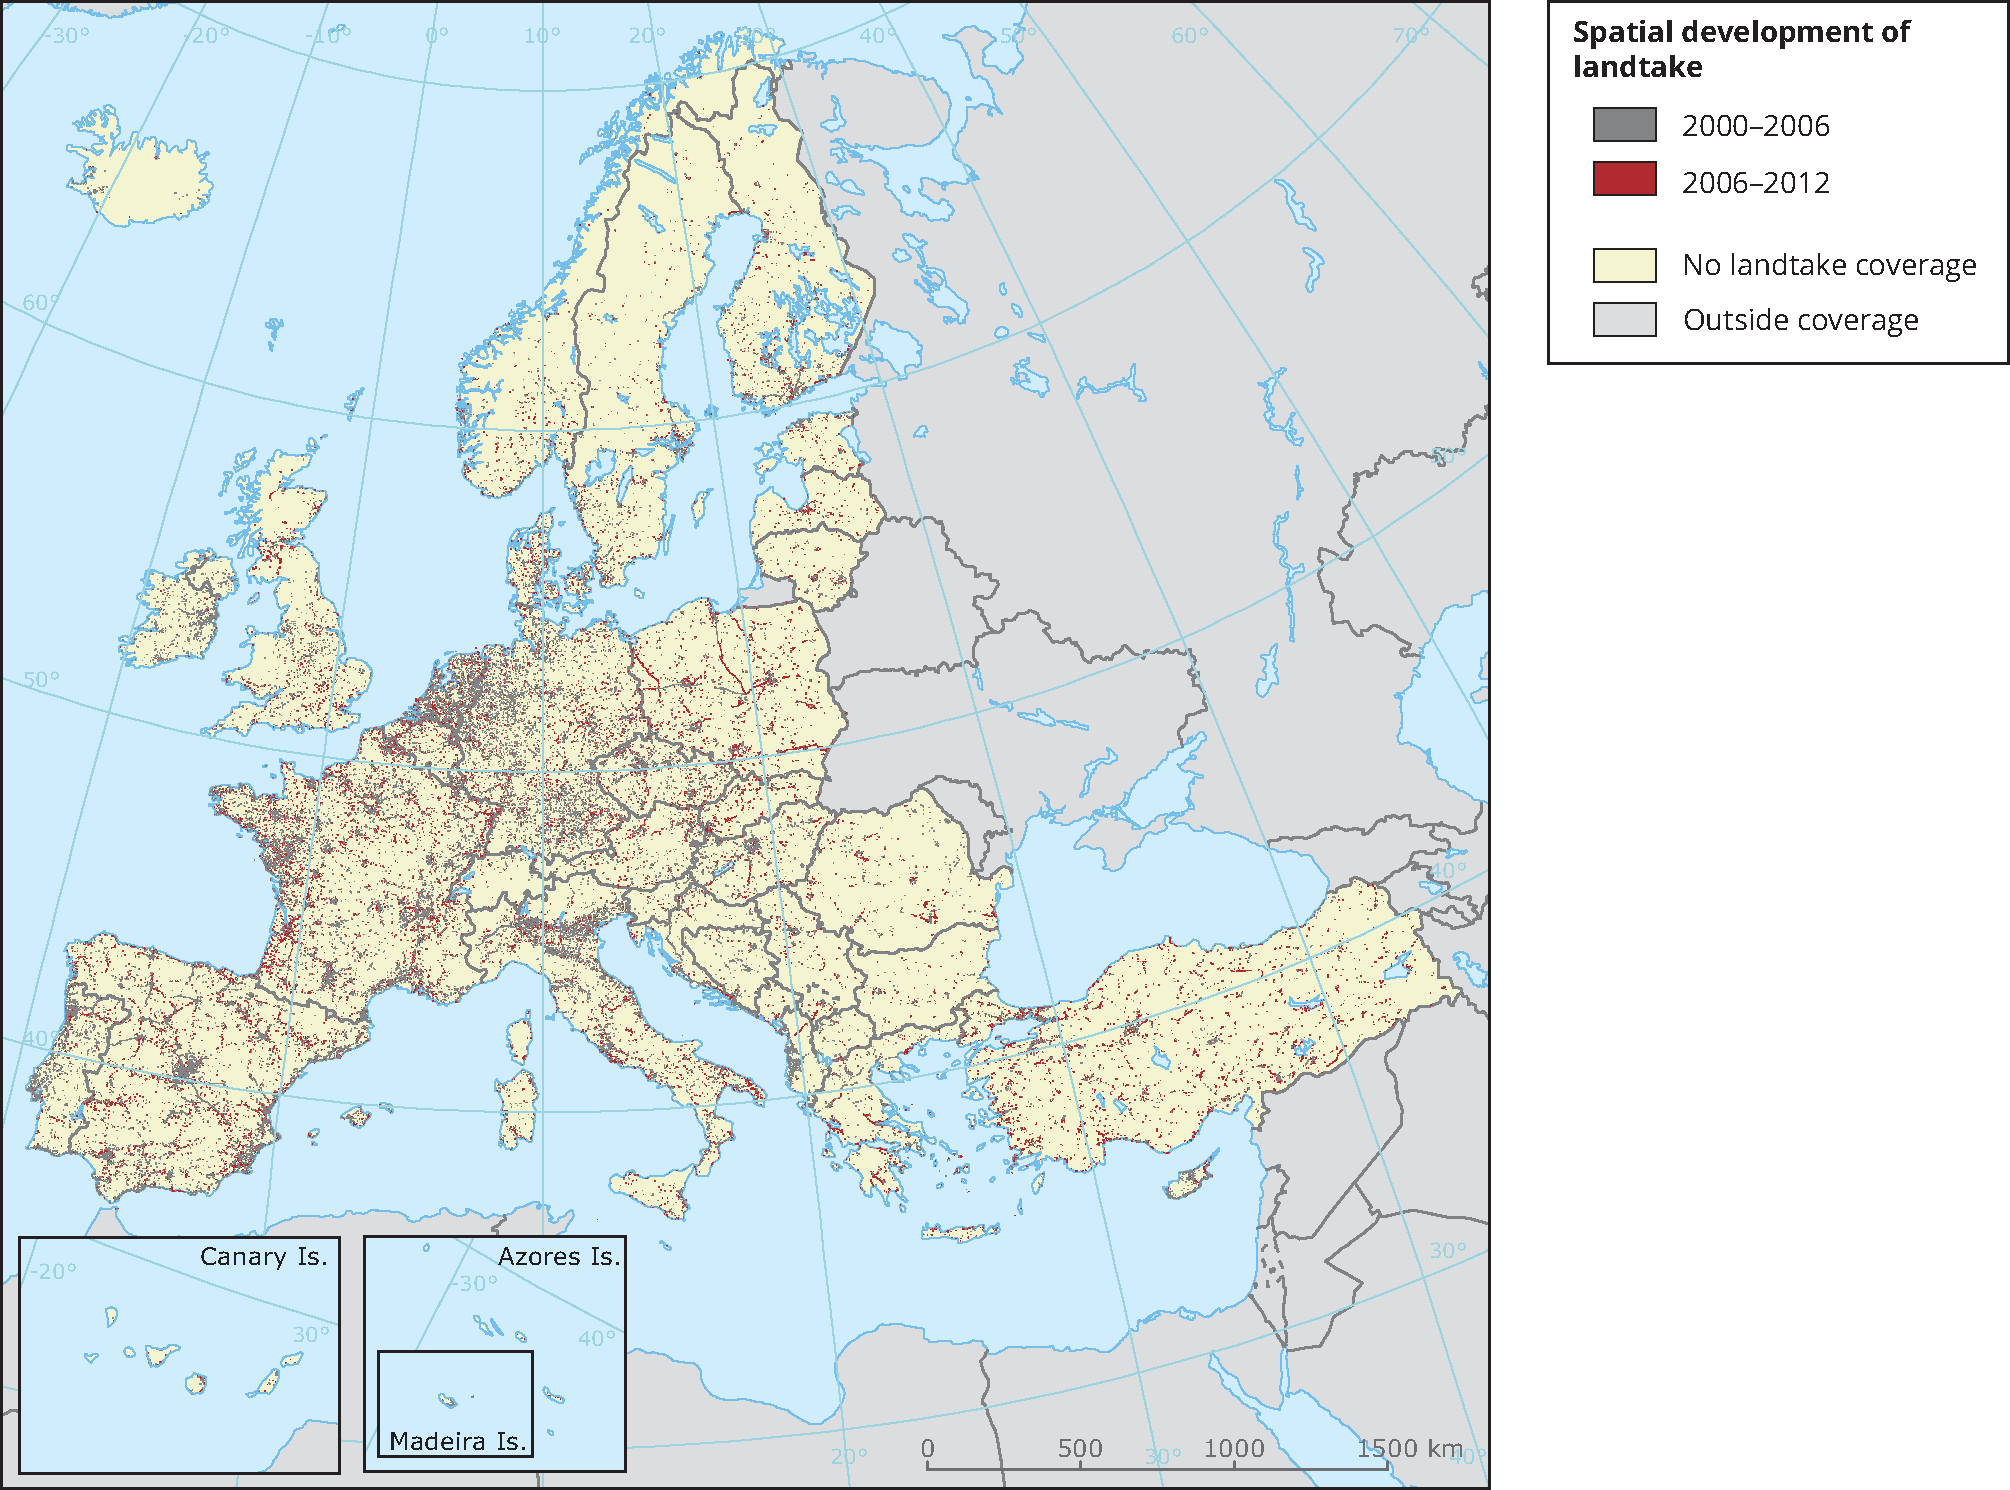
Data source: EEA, Spatial development of landtake
As the proportion of land used for production (agriculture, forestry, etc.) in Europe is one of the highest in the world, conflicting land use demands require decisions that involve difficult trade-offs. The decisions on trade-offs between land uses are effectively implemented through spatial planning and land management practice in the individual countries. Although the subsidiarity principle assigns land and urban planning responsibilities to national and regional government, most European policies have a direct or indirect effect on land planning and urban development. Where properly implemented, the Strategic Environmental Assessment (SEA; EC, 2001) and Environmental Impact Assessment (EIA; EC, 2014) Directives can improve the consideration of environmental aspects in spatial planning.
The average annual land take between 2000 and 2012 lay above the trajectory required to achieve the long-term goal of no net land take. However, annual land take declined between the 2000–2006 and 2006–2012 observation periods. If the amount of land taken reduces significantly during the next observation period, Europe could reach the required trajectory. However, it is uncertain whether a further reduction will take place and at what rate, particularly given the recent period of economic recovery following the economic downturn. The outlook to 2020 therefore remains uncertain.
One way to reduce the rate of land take in future is through the redevelopment of brownfield land. Brownfield sites are derelict and underused or even abandoned former industrial or commercial sites, which may have real or perceived contamination problems (EC, 2012). These sites are mainly found in urban areas of industrialised regions. Redevelopment of brownfield sites gives many environmental advantages: relieving pressure on rural areas and greenfield sites, reducing the costs of pollution, allowing more effective use of energy and natural resources and facilitating economic diversification. Another way to reduce the rate of land take in future is by higher density development, i.e. more buildings or a higher population on a given area of land (EEA, forthcoming).
Country level information
Figure 3 shows the mean annual rate of land take in EEA member and cooperating countries (EEA-39) between 2006 and 2012. The graph ranks countries on the basis of increases in land take as a percentage of the initial artificial land stock in 2006. Perhaps surprisingly, the countries with the highest percentage of land take include those that are already highly urbanised and therefore had an already high initial percentage of artificial land stock in 2006. Countries that enjoyed strong economic growth between 2006 and 2012 also had high levels of land take, indicating the need for further decoupling.

Outlook beyond 2020
If the urban population of Europe continues to grow, the pressure to develop on natural and semi-natural land will continue. If the objective of ‘no net land take by 2050’ is to be met, new developments in future should increasingly have to either take place on brownfield land or fill in gaps between existing developments (densification), or land take should have to be compensated for by reclaiming of artificial land back to arable or semi-natural land cover types. Such developments could be driven by establishing incentives for ‘land recycling’, e.g. encouraging developers to use brownfield land or encouraging spatial planning that favours increasing urban density. The extent to which land take can be reduced in the longer term will also be influenced by the ability of the EU and individual Member States to coordinate their spatial planning and environmental protection objectives.
About the indicator
The indicator shows the amount of land that is converted from natural and semi-natural areas, including forested and agricultural areas, to artificial surfaces used for urban and economic purposes. It includes areas sealed by the construction of buildings and infrastructure, as well as surface mining, urban green areas and sport and leisure facilities.
The indicator is based on the interpretation of satellite imagery from 1990, 2000, 2006 and 2012 (the most recent). The main dataset (Corine Land Cover) used by the indicator does not map features with an area less than 25 ha (5 ha for change) and less than 100 m across. This leads to the exclusion of small areas of land and small changes due to man-made features, particularly in the peri-urban countryside, and it also means that most land taken by linear transport infrastructure (e.g. roads and railways) is not captured, as it is too narrow to be picked up. On the other hand, land take areas accounted for contain unsealed surfaces such as suburban gardens and other smaller green plots.

Document Actions
Share with others