Chapter 10. Use of natural resources, landscapes and ecosystem resilience
• The landscape reflects how we meet our resource demands
• How and where we use land affects ecosystem resilience
• Consumption patterns are key drivers of resource use
• Spatial planning is central to managing landscapes and ecosystem resilience
Chapter 11. Progress towards ecosystem resilience and resource efficiency
• Europe has made considerable progress but many challenges remain
• Time lags between improving resource efficiency and ensuring ecosystem resilience
• Setting targets to support ecosystem resilience and resource efficiency
• Environmental indicators to support the transformation to a green economy
10. Use of natural resources, landscapes and ecosystem resilience
The landscape reflects how we meet our resource demands
Human health and well-being ultimately depend on well-functioning ecosystems. Human land use is a major factor influencing the distribution and functioning of ecosystems, and thus the delivery of ecosystem services. The impact of human society on ecosystems and natural capital respectively, can be most easily appreciated at the landscape level, as the landscape in many ways embodies how human society meets its resource demands.
The natural resources that society relies on for production and consumption can be roughly classified into four major categories: food, water, energy and (other) materials. All are of direct relevance to human well-being, and their supply is therefore subject to strong policy interventions. Exploiting one resource type often results in impacts on the environment and the other resources. For example, producing food requires land as well as water and energy.
These interdependencies lead to trade-offs and indirect effects on health and human well-being (Figure 10.1). Measures to boost agricultural productivity, for example, may have negative effects. Irrigation adds to water stress, particularly in southern European regions, potentially jeopardising water security (EEA, 2010a). Pesticide residues end up in surface water and groundwater bodies, threatening drinking water safety (EEA, 2010b).
Producing bioenergy involves similar trade-offs. Energy crops compete with food production, renewing concerns about food security and prices. Where energy cropping replaces extensive farming systems, negative impacts on biodiversity and landscape amenity values can also be expected, affecting, for example, recreation opportunities. Efforts to cut greenhouse gas emissions by shifting from fossil fuel to bioenergy can even be counterproductive if associated with deforestation and reduced carbon storage in vegetation and soil.
Matching natural resource use with human demands is thus a complex spatial puzzle, with many interdependencies and environmental feedbacks. This puzzle is further complicated when the external perspective is considered: analysing how European resource needs and the ways we meet them affect regions outside Europe.
Figure 10.1 Key natural resources supporting human health and well-being
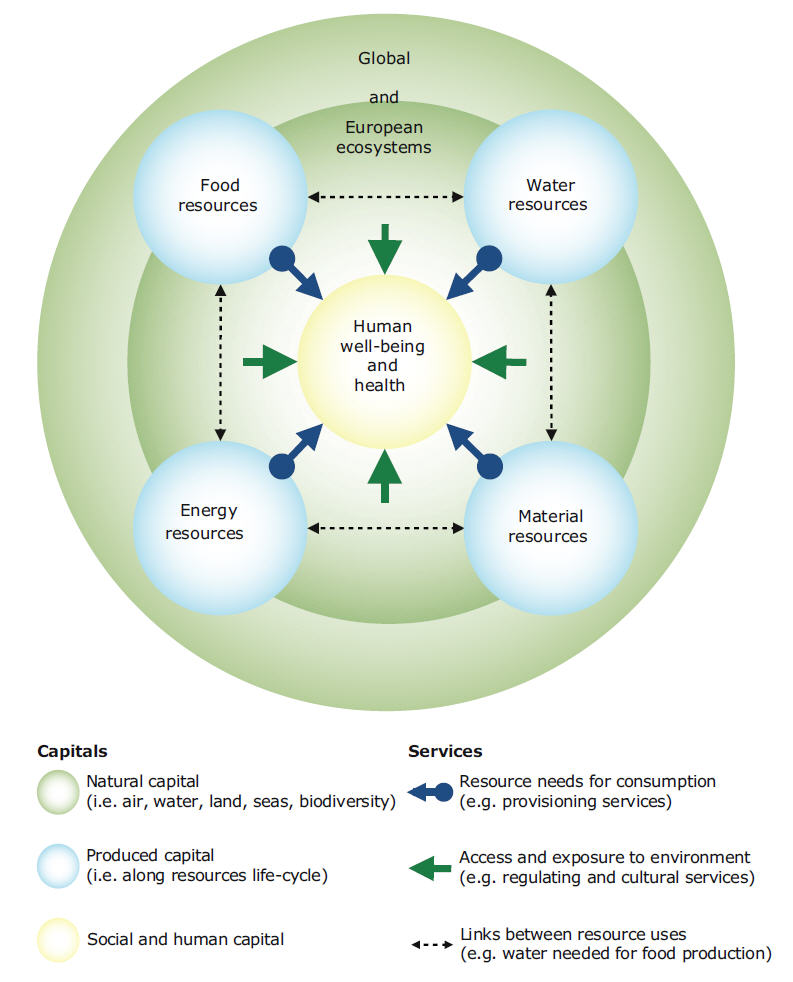
Source: European Environment Agency.
How and where we use land affects ecosystem resilience
Generally, increasing resource use has profound impacts on the landscape. Food and fibre production require large areas of land for agriculture and forestry. Extracting minerals, metals and fossil fuels turns substantial areas into quarries and mines. Our water use results in changed hydromorphology and river flows. And our settlement, infrastructure and construction patterns translate into further land use changes (Figure 10.2 and Map 10.1).
Population growth and changing lifestyles are apparent in our settlement patterns, transport infrastructure and land use. Europe stands out as one of the regions where human use of ecosystems is highest. Approximately one third of Europe's land is covered by forests, 25 % by arable land and permanent crops, and 17 % by pastures and mixed mosaics. About 4 % is covered by artificial surfaces, such as urban areas and man-made infrastructure (EEA, 2010c) (15).
Figure 10.2 Land take per activity, 2000 to 2006
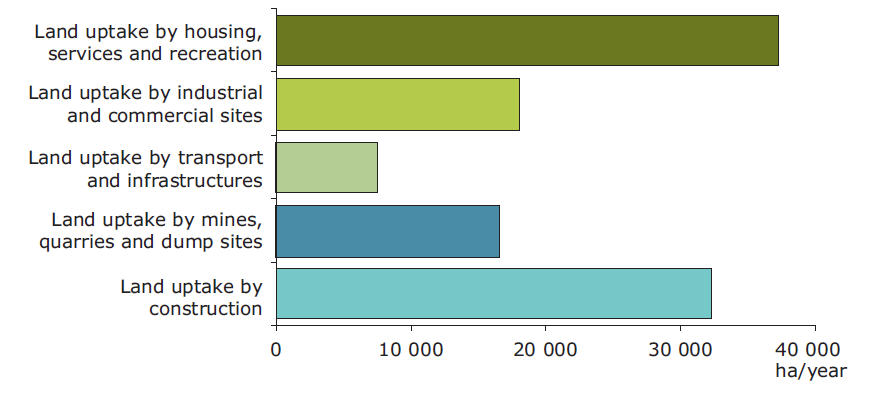
Source: CSI 014, based on Corine land cover database, 2000–2006 data.
Map 10.1 Fragmentation of the European landscape, as measured in terms of land take, 2000 to 2006
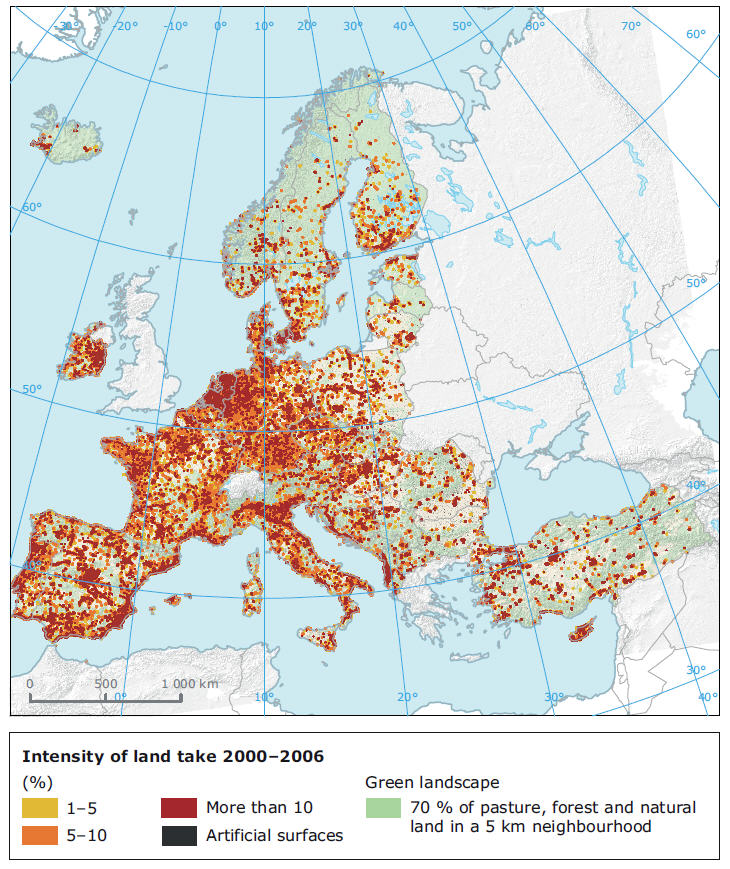
Source: CSI 014, based on Corine land cover database, 2000-2006 data.
Urbanisation is the dominant trend in Europe, with a growing concentration of people living in urban areas and decreasing population densities in rural areas. The total urban area in Europe grows faster than the human population size, indicating an increasingly diffuse urbanisation process and continuing landscape fragmentation (EEA, 2010c).
With many people seeking alternative employment and adopting urban lifestyles, agriculture is becoming less important as an economic driver. Environmentally it is still very important, however, covering nearly half of the European land. The total area of farmland in Europe is slowly decreasing as the result of land abandonment in marginal and low-productive regions. Management in the remaining farmland is typically intensifying, with around 4% of European farmland being under organic production in 2007 (Eurostat, 2009).
As a result of these combined trends, the area of natural and semi-natural habitats has declined and is increasingly fragmented by built-up areas and transport infrastructure. These changes affect the amenity value of the European landscape and are also associated with reduced biodiversity. Loss of habitats as the immediate result of land conversions has led many species populations to decline. The remaining habitat patches become increasingly vulnerable to diffuse external pressures, causing further reduction of critical plant communities and species.
Agriculture plays a major role here through its increasing reliance on drainage and external inputs over the last 50 years (fertiliser, pesticides and water – see previous chapters). It not only exerts environmental pressures at field level but also affects major regulatory services, notably those related to water, carbon and nitrogen. Animal species additionally suffer from the increased fragmentation, as reduced dispersal rates, mortality on roads and exposure to noise increase the risk of (local) extinction (EEA, 2010d).
Consumption patterns are key drivers of resource use
Ultimately, our resource use, both in Europe and beyond, is driven by our consumption and production patterns. Analyses of consumption patterns in EU Member States indicate that the majority of key environmental pressures related to national consumption can be allocated to eating and drinking, housing and infrastructure, and mobility and transport (EEA, 2010e). Food and housing alone cause around 60 % of all material resource use (Figure 10.3).
Average consumption expenditure per person increased by more than 30 % in the EU-27 between 1990 and 2010, with the 12 countries that have joined the EU since 2004 (EU-12) recording a relatively higher increase amounting to more than 75 % during the same period. Nevertheless, on average private consumption expenditure in the EU-15 is more than twice of that in the EU-12 (EEA, 2010e).
Figure 10.3 Share of Total Material Requirement (TMR) needed by household consumption category (8 EU Member States, 2005 data)
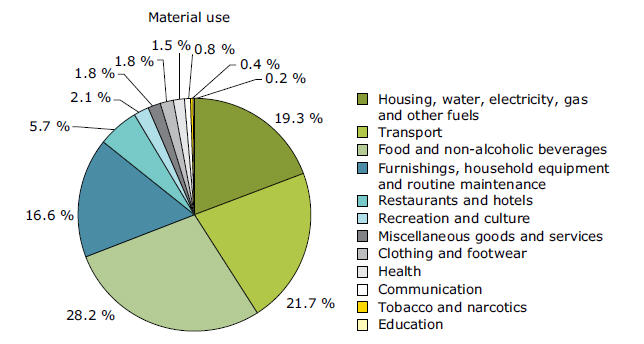
Source: EEA, 2010e.
Total energy use related to housing, for example, has increased by around 10 % since 1990, despite an increase in heating efficiency of approximately 10 % in the same period. A determining factor is the floor space per person, which between 1990 and 2007 has increased by more than 20% in the EU. The average area of a dwelling unit rose from 86 to 92 m2 in EU-15 Member States and from 62 to 71 m2 in EU-12 Member States. At the same time the number of people per household decreased. These trends have largely offset the gains made in the energy efficiency of buildings (EEA, 2010e).
Similarly, in the transport sector increased car fuel efficiency has not compensated for growing demand resulting from increased commuting and recreation. Although cars on average have become more fuel-efficient, overall fuel consumption for private cars does barely go down, mainly because more kilometres are driven (EEA, 2010e).
In the past decade, European expenditure on food and non-alcoholic drinks increased only by around 10 % in absolute terms. While total consumption of food in Europe is relatively decoupled from income, the types of food we eat has changed with increasing wealth, falling household sizes, globalisation of food markets and changing tastes – resulting in mixed trends in food consumption (EEA, 2010e). Mixed trends in food consumption have differing consequences for environmental impacts and their combined effect is difficult to estimate.
The carbon, material and water footprints of different types of food vary considerably (the footprints associated with beef and dairy products, for example, are relatively high), which hints at potential to reduce some environmental impacts by shifting consumption patterns. To improve resource use efficiency, there is also scope to address food wastes, as waste generation in production, distribution and consumption of food accounts for approximately 89 million tonnes of food yearly (roughly 180 kg per citizen) (EEA, 2010e).
Spatial planning is central to managing landscapes and ecosystem resilience
Overall, growing resource demand has driven environmental pressures, for example, through greenhouse gas emissions, emissions of acidifying substances or ozone precursors, our material use and waste production (EEA 2010e). Meanwhile, our settlement patterns have affected our personal exposure to the consequences of this resource use — air pollution, food and water quality, access to green spaces, flooding risks and so on.
European landscapes are being shaped at an unprecedented pace, with little thought to these cumulative impacts. Their importance is not yet fully reflected in decision-making on urban development, energy supply, agriculture, forestry, water management and transport. Considerations such as biodiversity and landscape quality are likewise often marginalised in decision-making processes.
With most EU citizens living in urban areas (currently 73% and projected to grow to 80 % by 2030, EEA, 2010f), urban density and the design of the built and natural environments of cities play a crucial role in shaping consumption patterns. Urban design is particularly relevant in two areas: urban transport, which accounts for 40 % of GHG emissions and 70 % of air pollutants, and housing (EC, 2007).
Optimising land use in response to consumer demands has implications for carbon storage (bioenergy production and greenhouse gas emissions), water resources (droughts and floods) and biodiversity conservation (impacts on species and habitats). The main alternative principles of land planning in this regard are 'land sparing' or 'land sharing'.
'Land sparing' focuses on compact urbanisation and intensification of agriculture (increasing yields per hectare), with a view to reduce the area needed for housing and agricultural production. This is in principle beneficial for energy efficiency and carbon storage and leaves space for natural ecosystems and nature development. On the other hand it may increase local pressures on soil, water and air and affect human health in urban areas.
'Land sharing' does the opposite: it tries to accommodate multifunctional land use, supporting extensive agriculture in marginal areas and attempting to achieve biodiversity goals on farmland. In a European context this approach applies to the conservation of high nature value farmland and the adoption of agri-environment measures. The area of non-cultivated ('natural') areas is of less concern than cultural and landscape amenity values.
The choice between the two involves complex trade-offs with regard to ecosystem resilience and resource efficiency that require careful consideration. For example, whereas low-input farming appears essential to tackle pollution, it enhances the need for changes in our consumption and behaviour. Dietary shifts, more effective distribution chains, and food waste prevention could potentially compensate for lower yields.
Given the interactions between agricultural land use and European and global environmental processes, appropriate management and policies in the agricultural sector are crucial for achieving EU environment policy targets. The EU common agricultural policy is currently undergoing a fundamental reform, offering a big opportunity for further integrating environmental concerns into this policy.
Similarly, integrating fragmentation considerations, including monitoring methods, into transport and regional planning policies, can further help to mitigate the environmental impacts of landscape fragmentation.An integrated development perspective is needed to take into account the considerable regional variation, in both environmental and socio-economic terms. The structural funds under the EU cohesion policy aimed at territorial cohesion are instrumental in this respect.
Box 10.1 Ecosystem integrity — an experimental integrated indicator
The Convention on Biological Diversity has identified ecosystem integrity as one of four thematic areas for monitoring policy progress towards significantly reducing biodiversity decline. It is a key determinant of the potential of ecosystems to deliver over time the multiple services needed for societal development and human wellbeing.
A proxy for ecosystem integrity at the macro scale is landscape fragmentation, and particularly the fragmentation of natural habitats. The Natural Landscape Ecological Potential (NLEP) indicator takes protected area designations, land cover characteristics and density of road and rail transport infrastructure into account. Datasets are combined using land and ecosystem accounting methods and spatial analysis techniques, anchored by a 1 km2 grid.
For the period 1990–2006, the NLEP indicator ecosystem integrity has either been stable or in slow decline for most of Europe. Where improvement appears it is largely the effect of farmland abandonment in this period (Map 10.2).
Map 10.2 Changes in ecosystem integrity based on changing landscape characteristics, 1990 to 2006
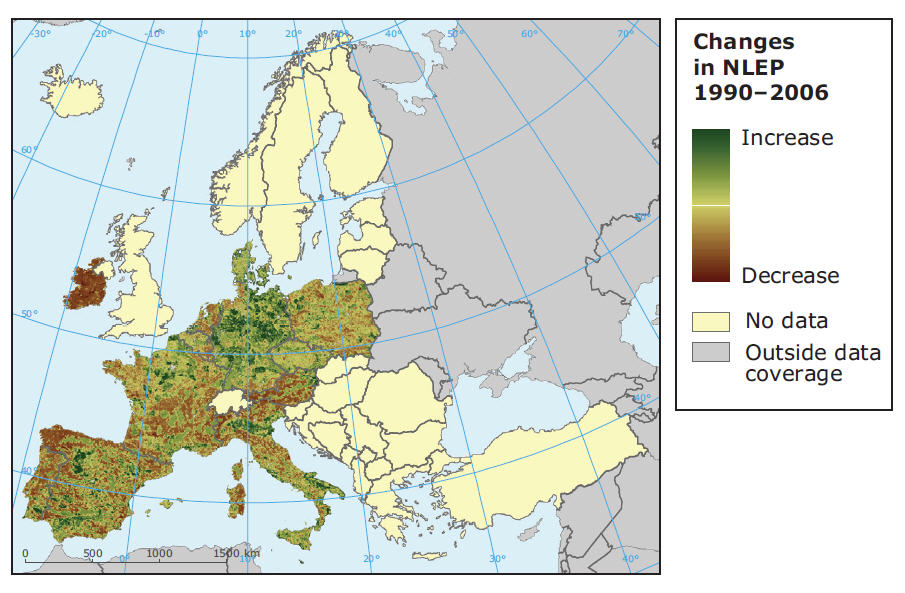
Source: European Environment Agency.
11. Progress towards ecosystem resilience and resource efficiency
Europe has made considerable progress but many challenges remain. Some of the environmental indicators analysed in this report reveal encouraging trends, others less so.
In some areas, significant progress has been made. Over the past decade, for example, European greenhouse gas emissions have decreased; some air and water pollution indicators show improvements, although this has not yet necessarily resulted in good air and water quality; and materials use and waste generation, although still increasing, are now growing at a slower rate than the economy. However, developments in different European countries may differ considerably from these broad trends.
In other areas, trends are less positive. Environmental objectives and targets have not been achieved or progress has been insufficient. The target of halting biodiversity loss in Europe has not yet been reached, although large areas across Europe have been designated as protected areas and the rate of loss for some species has decreased. Fish continue to be harvested beyond sustainable yields and many freshwater bodies suffer from over-exploitation and are not expected to achieve good ecological status by 2015.
Based on such environmental indicators, a summary analysis of the main trends and progress over the past ten years shows a mixed picture. If indicators are broadly grouped in two categories either addressing 'ecosystem resilience' (here approximated by 'state' indicators) or 'resource efficiency' (here approximated by 'pressure' indicators), then a pattern emerges: European environmental policies appear to have had a clearer impact on improving resource efficiency than on maintaining ecosystem resilience (Table 11.1).
Table 11.1 Indicative summary table of progress towards meeting environmental targets or objectives, based on indicators presented in this report
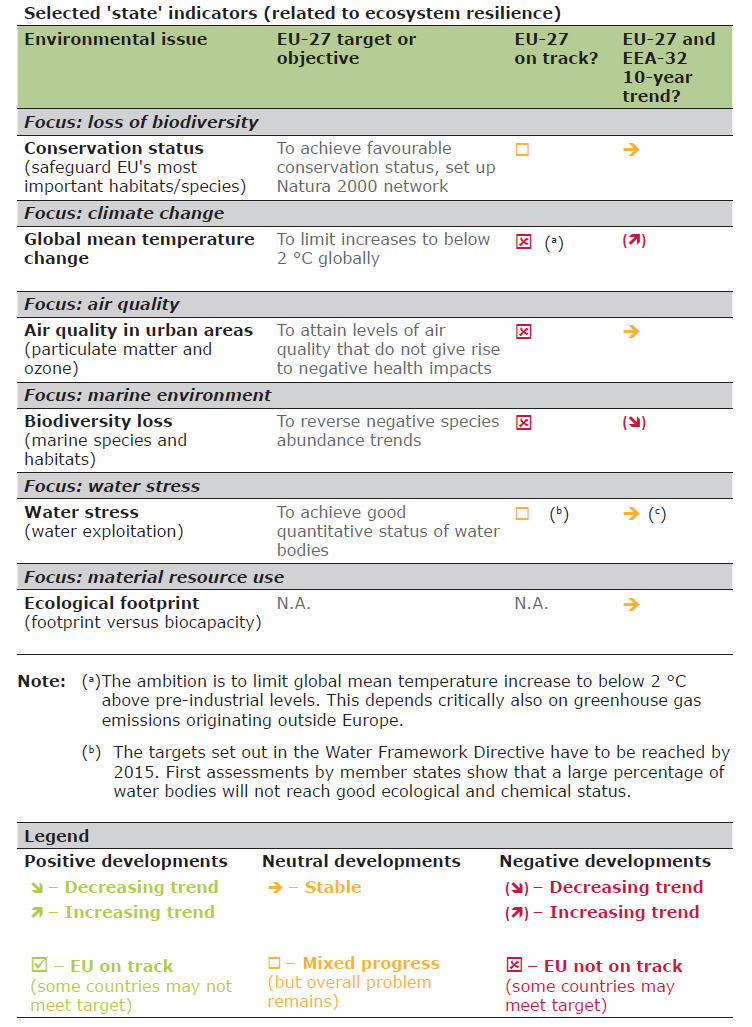
Table 11.1 Indicative summary table of progress towards meeting environmental targets or objectives, based on indicators presented in this report (cont.)
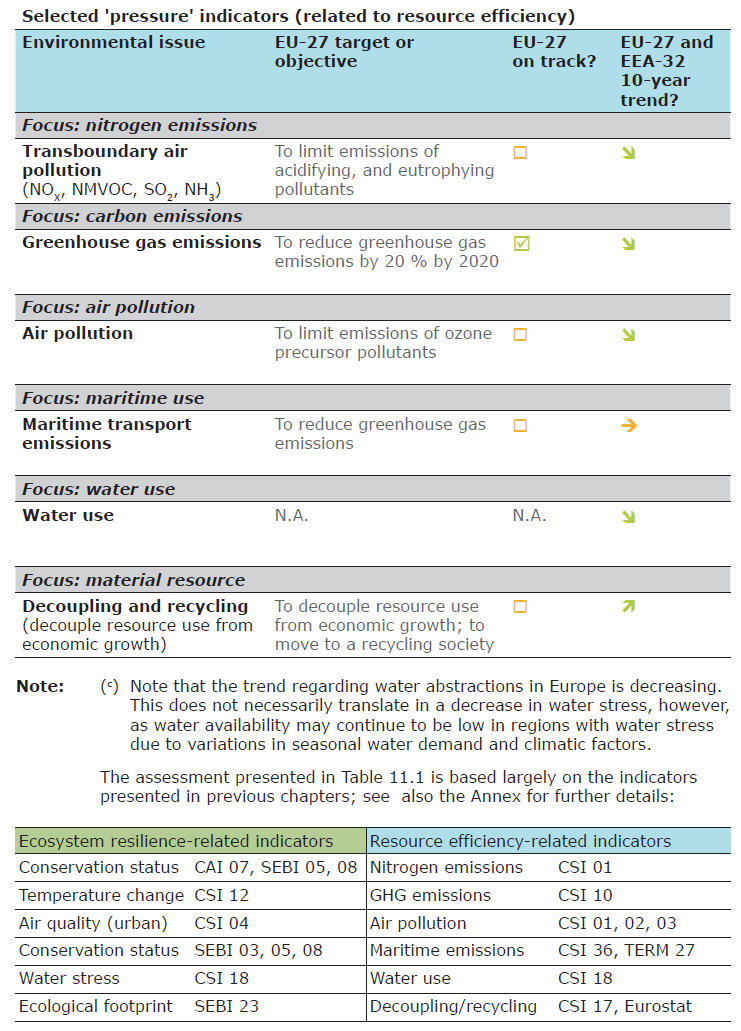
It is worth noting that several important environmental issues are either not covered or only partially addressed in this summary analysis. This is either because they have only emerged on the policy agenda in recent years or because they lack explicit targets and indicators. Such issues include, for example, ecosystem health, ecosystem services, noise, chemicals and hazardous substances, and natural and technological hazards. These, and other environmental issues, are instead addressed or under preparation in separate, dedicated EEA assessments.
This summary analysis underlines that while improved resource efficiency is necessary, it is not sufficient to conserve the natural environment and the essential services it provides in support of economic prosperity and social cohesion.
Time lags between improving resource efficiency and ensuring ecosystem resilience
Many factors and complex interactions underlie the contrasting performance in improving resource efficiency and ensuring ecosystem resilience, as presented in this summary analysis. These include:
• the relatively specific cause-effect relationships and policy design involved in reducing environmental pressures and increasing resource efficiency in relevant economic sectors (such as energy, transport, agriculture);
• the often more complex, multicausal factors contributing to reductions in natural environment quality with consequent implications for ecosystem resilience (multiple causes, multiple pathways and multiple effects that are difficult to disentangle);
• the resulting shorter time frames needed to show efficiency gains (often less than two decades) against the longer time it takes for these gains to translate into restored environmental condition and ecosystem resilience (often several decades).
The relatively short time frame for this summary analysis is therefore biased towards showing progress in improving resource efficiency over ensuring ecosystem resilience. This in turn highlights the value of investing in consistent long-term monitoring of sentinel chemical and ecological parameters that allow us to track broader changes in the natural environment: atmosphere and climate, soils and land, freshwaters and oceans.
Over recent decades, EU environmental policies have regulated the release of harmful substances into the atmosphere, soils and waters, typically through targeted policies or restrictions. Such regulatory approaches have intentionally pushed firms to find substitutes through technical innovations and other routes.
It often takes years for these policies to take full effect. Consider, for example, the time span that occurs between a substance being identified as harmful and it being restricted. Causes of delays include lags in national transposition and implementation of EU laws, and the need to allow sufficient time to identify and adopt viable substitutes.
Despite these obstacles considerable efficiency gains have been achieved and environmental pressures have been reduced. Looking forward to reduction targets for 2020 and beyond, however, it is apparent that in areas such as climate change mitigation, energy, material, water and waste Europe will need to continue (and in some cases drastically increase) its resource efficiency improvements just to meet current policy targets. Achieving the even more ambitious targets needed to ensure a resilient environment will require even greater efforts.
This dynamic is further complicated by the often even longer time lags between recognising an environmental pressure and this being addressed, and the ability of natural ecosystems and people to then recover from the impacts these pressures may have caused. In other words, once the environment has changed as result of an environmental pressure, it may take much longer to reverse, especially if and when this has resulted in a change in ecosystem resilience.
A case in point is the depletion of the ozone layer, where the relatively rapid progress to remove harmful chlorofluorocarbons (CFC) from production processes and reduce their emissions (which took about 20 years, globally), contrasts with the rather longer timeframes foreseen for repairing the atmosphere and reducing to zero excess skin cancer rates from ultraviolet radiation (estimated to be 70 to 100 years). Similar time lags are known for other environmental issues, such as climate change or acidification.
It should be stressed that in some cases, negative effects of reduced ecosystem resilience may even be irreversible, for example where biodiversity loss leads to species extinction, or where environmental or climate tipping points are passed.
Setting targets to support ecosystem resilience and resource efficiency
EU environmental policy includes many more objectives and targets than those discussed in this report. When fully implemented as a coherent package, how far would existing measures ensure ecosystem resilience and improve resource efficiency, given the clear differences in the challenges and the contrasting time lags for achieving success?
This report cannot and does not aim to answer this question. It does, however, highlight that the interplay between improved resource efficiency, decreased environmental pressures and maintaining ecosystem resilience is often ill-defined. And this jeopardises the coherence between different environmental policies and between environmental policy and other policy areas. Existing European environmental policies have proven effective in many cases but less so in some instances.
Air pollution, climate change mitigation, energy, water and waste are arguably the environmental policy areas where objectives and binding targets are most developed. Other policy areas like chemicals, land use, nature and biodiversity, and sustainable production and consumption are characterised by ambitious strategic objectives and few binding targets. While the former are often incorporated into European legislation (such as regulations, directives and decisions), the latter are generally set out in other formats (such as European Commission communications, EU environment action programmes or the European Council conclusions).
At the EU level, arguably the clearest links between objectives to ensure ecosystem resilience and objectives to ensure resource efficiency have been established in the area of climate change. An example is the ambition to limit the rise in average global temperatures to 2 °C compared to pre-industrial levels and the related target to reduce greenhouse gas emissions by 20 % by 2020, and the vision to reduce them by more than 80 % by 2050. Clearly, however, meeting the global temperature objective depends not only on actions within Europe but also internationally.
Such links are also apparent for air pollution. The success of much of Europe in meeting efficiency targets by cutting emissions has played a vital role in reducing critical loads and resulting pressures on sensitive ecosystems. At the same time, however, concerns about pressures on biodiversity — including those resulting from nitrogen pollution — have increased. More positively, greater attention is now given to understanding the co-benefits for the atmosphere of achieving climate change and air pollution efficiency targets as a package.
For other policy areas such as freshwater, oceans and biodiversity, recent EU initiatives have sought to strengthen objectives for ecosystem resilience, such as achieving 'good ecological status' in water bodies or maintaining ecosystem services. Alongside these, there are also resource efficiency targets either established or emerging in those sectors related to biodiversity loss. However, the relationship between resilience and efficiency targets in the area of biodiversity is arguably less well defined than, say, for air pollution and climate change.
For all the above examples and for other issues, ensuring coherent environmental policy demands explicit reflection on how objectives related to ensuring ecosystem resilience (or, simpler put, maintaining a good state of environment) can be translated into targets to improve resource efficiency. In addition, it is worth considering how a more combined approach to ecosystem resilience and resource efficiency would influence human well-being, access to environmental benefits and other social policy objectives.
Thus, in striving towards a 'green economy' — that is an economy in which environmental, economic and social policies and innovations enable society to use resources efficiently, thereby enhancing human well-being in an inclusive manner, while maintaining the natural systems that sustain us — there would be value in considering objectives and targets in integrated packages around key environmental topics. In setting objectives, such packages should explicitly recognise the relationships between resource efficiency, ecosystem resilience and human well-being as well as the different time lags for policy actions to succeed.
Such relationships might be considered both within an environmental policy area, such as biodiversity, and between policy areas, such as between biodiversity and climate change, taking account of issues such as differences in geographical scale when considering problems, solutions and trade-offs. Mapping the many interlinkages between areas and related policy targets would be a prelude to the design of policy measures and indicators that make environmental policy implementation stronger and more coherent, and enable existing objectives and targets to be achieved more effectively.
Environmental indicators to support the transformation to a green economy
In the 1980s and early 1990s, environmental concerns motivating indicator choices were mostly related to the specific challenges of industrialised countries: air and water pollution, waste generation, environment and health impacts, landscape amenities and nature conservation in terms of protection of endangered species and habitats. Since the 1990s, the recognition of more diffuse challenges has driven demand for indicators to support integration of environmental considerations into the sectoral domains with the greatest environmental impacts, e.g. energy, transport, agriculture, industry (Table 11.2).
Table 11.2 Reflecting on environmental challenges
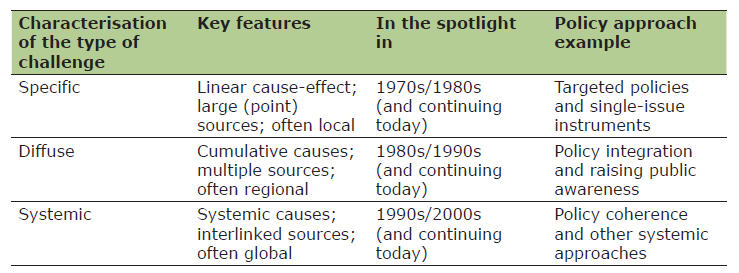
Source: European Environment Agency.
At the same time, more complex, systemic environmental issues such as climate change impacts, biodiversity loss, resource scarcities and cocktail effects on human health have come to the fore driving demands for more integrated indicators across the entire DPSIR chain (see Chapter 3). The globalisation cycle since the 1990s has been a major reason for this. For example, good performance in Europe in reducing pressures has sometimes resulted from the shift of polluting industries to less industrialised countries.
Related to this, in Europe and elsewhere, the need to account for natural and human resources as capital, in the same way as we account for economic and financial resources, is becoming more apparent. The multiple crises Europe and the world currently face — financial debts, economic recession, demographics, energy security, climate change, biodiversity loss and ecosystems degradation — have raised the profile of issues such as systems resilience, transparency and accountability, debts, distributional equity, fairness and liability. The transition to a green economy can contribute to resolving many of these issues.
What could we consider as suitable indicators for measuring progress in the transition?
The demand for more integrated environmental indicators measuring overall progress has driven many trials (16). All fall short of the requirements, however, largely due to their partial coverage of and partial correspondence to European policy priorities. Thus, among the 225 indicators currently managed by the EEA (see Annex) there is no indicator that responds to this political demand (i.e. indicator type E — total welfare indicators).
The task to develop macro level metrics that can complement GDP is not trivial, as reflected most recently in the report of the 'Stiglitz-Fitoussi-Sen Commission' initiated by the Government of France (2007), or the European Commission's related 'GDP and Beyond' process (2008). These initiatives share common features. For example, in the short term, a basket of interlinked, coherent indicators to measure progress across the environmental, social and economic domains is regarded as feasible.
Such a basket of indicators that can address the systemic, interlinked challenges of resource efficiency, ecosystem resilience and human well-being would ideally feature key environmental resource dimensions such as materials, carbon, land and water individually, their uses as well as their respective interactions (see, for example, the schema offered in chapter 10 of this report). As such, it would be diagnostic rather than comprehensive.
This report demonstrates that several relevant indicators are already available to address both ecosystem resilience and resource efficiency by proxy. Additional ones can be constructed using environmental accounting, for example using NAMEA (17), or life-cycle methods, with the aim to produce indicators that can cover national, sectoral, product and trade perspectives.
In addition, a link to human well-being can be ensured in two principal ways. The first is through an explicit link between resource efficiency and how we are meeting our needs for food, water, energy and materials resources. The second is through establishing links between natural capital parameters and where people live, to better understand their access to nature or vulnerability to environmental change.
All the aforementioned baskets of indicators address physical changes. Changes in stocks of natural capital might also be evaluated in monetary terms and incorporated into the System of National Accounts (SNA), to complement GDP. Indeed, the architects of the SNA identified this approach as desirable as far back as the early 1950s. Also the EU Roadmap to a Resource Efficient Europe includes a milestone whereby public authorities and businesses will properly value and account for natural capital and ecosystem services by 2020.
However, the task of establishing credible links between the different capitals is complex, and fraught with conceptual difficulties and ethical concerns.
As noted above, indicators available to date offer only a sub-set of those ideally needed to address coherently systemic and interlinked environmental challenges. Nevertheless, the assessment presented in this report also highlights that those environmental indicators already available offer some basis for considering strategic objectives and targets with regard to both ecosystem resilience and resource efficiency.
Notes:
(15) The remaining European land area is classified as semi-natural vegetation (8 %), open spaces and bare soils (6 %), wetland (2 %) and water bodies (3 %). >back
(16) Examples include the index of sustainable economic welfare, the environmental pressure index, the ecological footprint, and the OECD better life index, to name a few. >back
(17) NAMEA — National Accounting Matrix for Environmental Accounting. >back

Document Actions
Share with others