Introduction
Air pollution has negative impacts on both terrestrial and aquatic ecosystems, degrading environments and reducing biodiversity. This chapter examines the exposure of vegetation to key air pollutants. It draws on both modelled estimates of total exposure and on measurements from monitoring stations in rural areas.
Ground-level ozone (O3) damages agricultural crops, forests and plants by reducing growth rates, lowering yields, and by affecting biodiversity and ecosystem services. In one example, evidence of the impact of ozone on the wheat harvest in 2019 is presented (see ‘Wheat yield loss due to exposure to ozone’).
Certain air pollutants are deposited on the Earth’s surface, thereby degrading receiving ecosystems. Nitrogen oxides (NOX) and ammonia (NH3) in the air are deposited on land and in water bodies, resulting in the introduction of excessive amounts of nitrogen. In water bodies, this contributes to eutrophication, whereby excess nutrients drive algal blooms and reduce oxygen availability. In sensitive terrestrial ecosystems such as grasslands, the exceedance of critical loads for nitrogen deposition can drive the loss of sensitive species, the increased growth of species that benefit from high nitrogen levels and changes to ecosystem structure and function.
The deposition of sulphur dioxide (SO2), NOX and NH3 leads to changes in the chemical composition of soils, lakes, rivers and marine waters through a process known as acidification, which disrupts ecosystems and leads to biodiversity loss. As SO2 emissions have fallen significantly over recent decades, the relative contribution made by NH3 and NOX to surface water and soil acidification has increased (EEA, 2019a).
Heavy metals are toxic pollutants that travel long distances in the atmosphere and are deposited into ecosystems, leading to the build-up of these contaminants in soils and their subsequent bioaccumulation and biomagnification in the food chain.
Air quality standards to protect vegetation
The ambient air quality directives set standards to protect vegetation from air pollution, including a target value and a long-term objective for ozone and critical levels of NOX and SO2.
Under the Air Convention of the United Nations Economic Commission for Europe (UNECE), the critical ozone exposure level for the protection of forests is defined as 10,000μg/m3 per hour over a period of April to September (UNECE, 2022).
The various standards are presented in Table 1.
| Pollutant | Averaging period | Standard type and concentration | Comments |
|---|
| O3 |
AOT40(a) accumulated over May to July |
EU target value: 18,000µg/m3 per hour |
Averaged over 5 years(b) |
|---|
| EU long-term objective: 6,000µg/m3 per hour |
|
| AOT40(a) accumulated over April to September |
Critical level for the protection of forests: 10,000µg/m3 per hour |
Defined under the UNECE Air Convention |
| NOx |
Calendar year |
EU critical level: 30µg/m3 |
|
|---|
| SO2 |
Winter |
EU critical level: 20µg/m3 |
1 October to 31 March |
|---|
| Calendar year |
EU critical level: 20µg/m3 |
|
Notes: (a) AOT40 is an indication of accumulated O3 exposure, expressed in μg/m3 per hour, over a threshold of 40 parts per billion (ppb). It is the sum of the difference between hourly concentrations of >80μg/m3 (40ppb) and 80μg/m3 accumulated over all hourly values measured between 08:00 and 20:00 (Central European Time).
(b) In the context of this chapter, only yearly AOT40 values, and not 5-year averages, are considered.
Vegetation exposure to ground-level ozone
The pollution of air by ground-level ozone damages vegetation. Ozone enters plant leaves and reduces photosynthesis, slowing a plant’s growth and increasing its vulnerability to pests and disease. At the ecosystem level, high levels of ground-level ozone can drive the loss of species diversity and lead to changes in ecosystem structure and habitat quality. In commercial agriculture, ozone reduces crop yields and forest growth.
The ambient air quality directive (EU, 2008) aims to protect vegetation from ozone by setting two standards: a target value that should have been met by 1 January 2010, and a long-term objective, with no defined attainment date.
Figure 1 presents modelled estimates of the percentages of total agricultural land exposed to ozone above the target value of 18,000µg/m3 per hour from 2000 to 2020 in the 32 EEA member countries (EEA-32). It shows that up to 2019, a significant portion of the European agricultural area was exposed to ozone levels above this value, with exceedances observed in central, southern and eastern Europe, and with a substantial annual variation. In 2018, a heatwave led to high ozone levels, and the proportion of agricultural land in the EEA-32 exposed above the target value peaked at 48%. In 2020, the proportion fell to a low of 6%.
Regarding the long-term objective of 6,000 μg/m3 per hour, in 2020, 77% of the EEA-32 agricultural area was exposed to ozone levels above this long-term objective.
The reduction in exposure to ozone in 2020 can be explained by several factors. Lower summer and spring temperatures over large areas of eastern and northern Europe and over some parts of the Iberian Peninsula than had been seen in the period 2007-2019, lead to lower ozone concentrations. In addition, emissions of ozone precursors, in particular NO2, fell during the COVID-19 lockdowns (EEA, 2022).
Under the UNECE Air Convention, the critical ozone exposure level for the protection of forests is set at 10,000μg/m3 per hour (UNECE, 2022). Any concentration in the atmosphere above this critical level may have direct adverse effects on plants and ecosystems. Despite significant annual variation, more than half of the total forested area of the EEA-32 has been exposed to ozone levels above the critical level every year since 2005 (Figure 2). In 2020, the critical level was exceeded in 59% of the total area.
Air quality monitoring stations aimed at assessing the protection of vegetation must be situated more than 20km from urban agglomerations or more than 5km from other built-up areas, industrial installations, motorways and major roads. Such monitoring stations are known as rural background stations.
Regarding monitoring data from rural background air quality stations, 10% of the stations that reported data registered values above the target value threshold. Moreover, 78% of rural background stations measured values above the long-term objective.
Regarding the exposure of forests, 84% of the rural background stations that reported data recorded values above the critical level for protection.
Wheat yield loss due to exposure to ozone
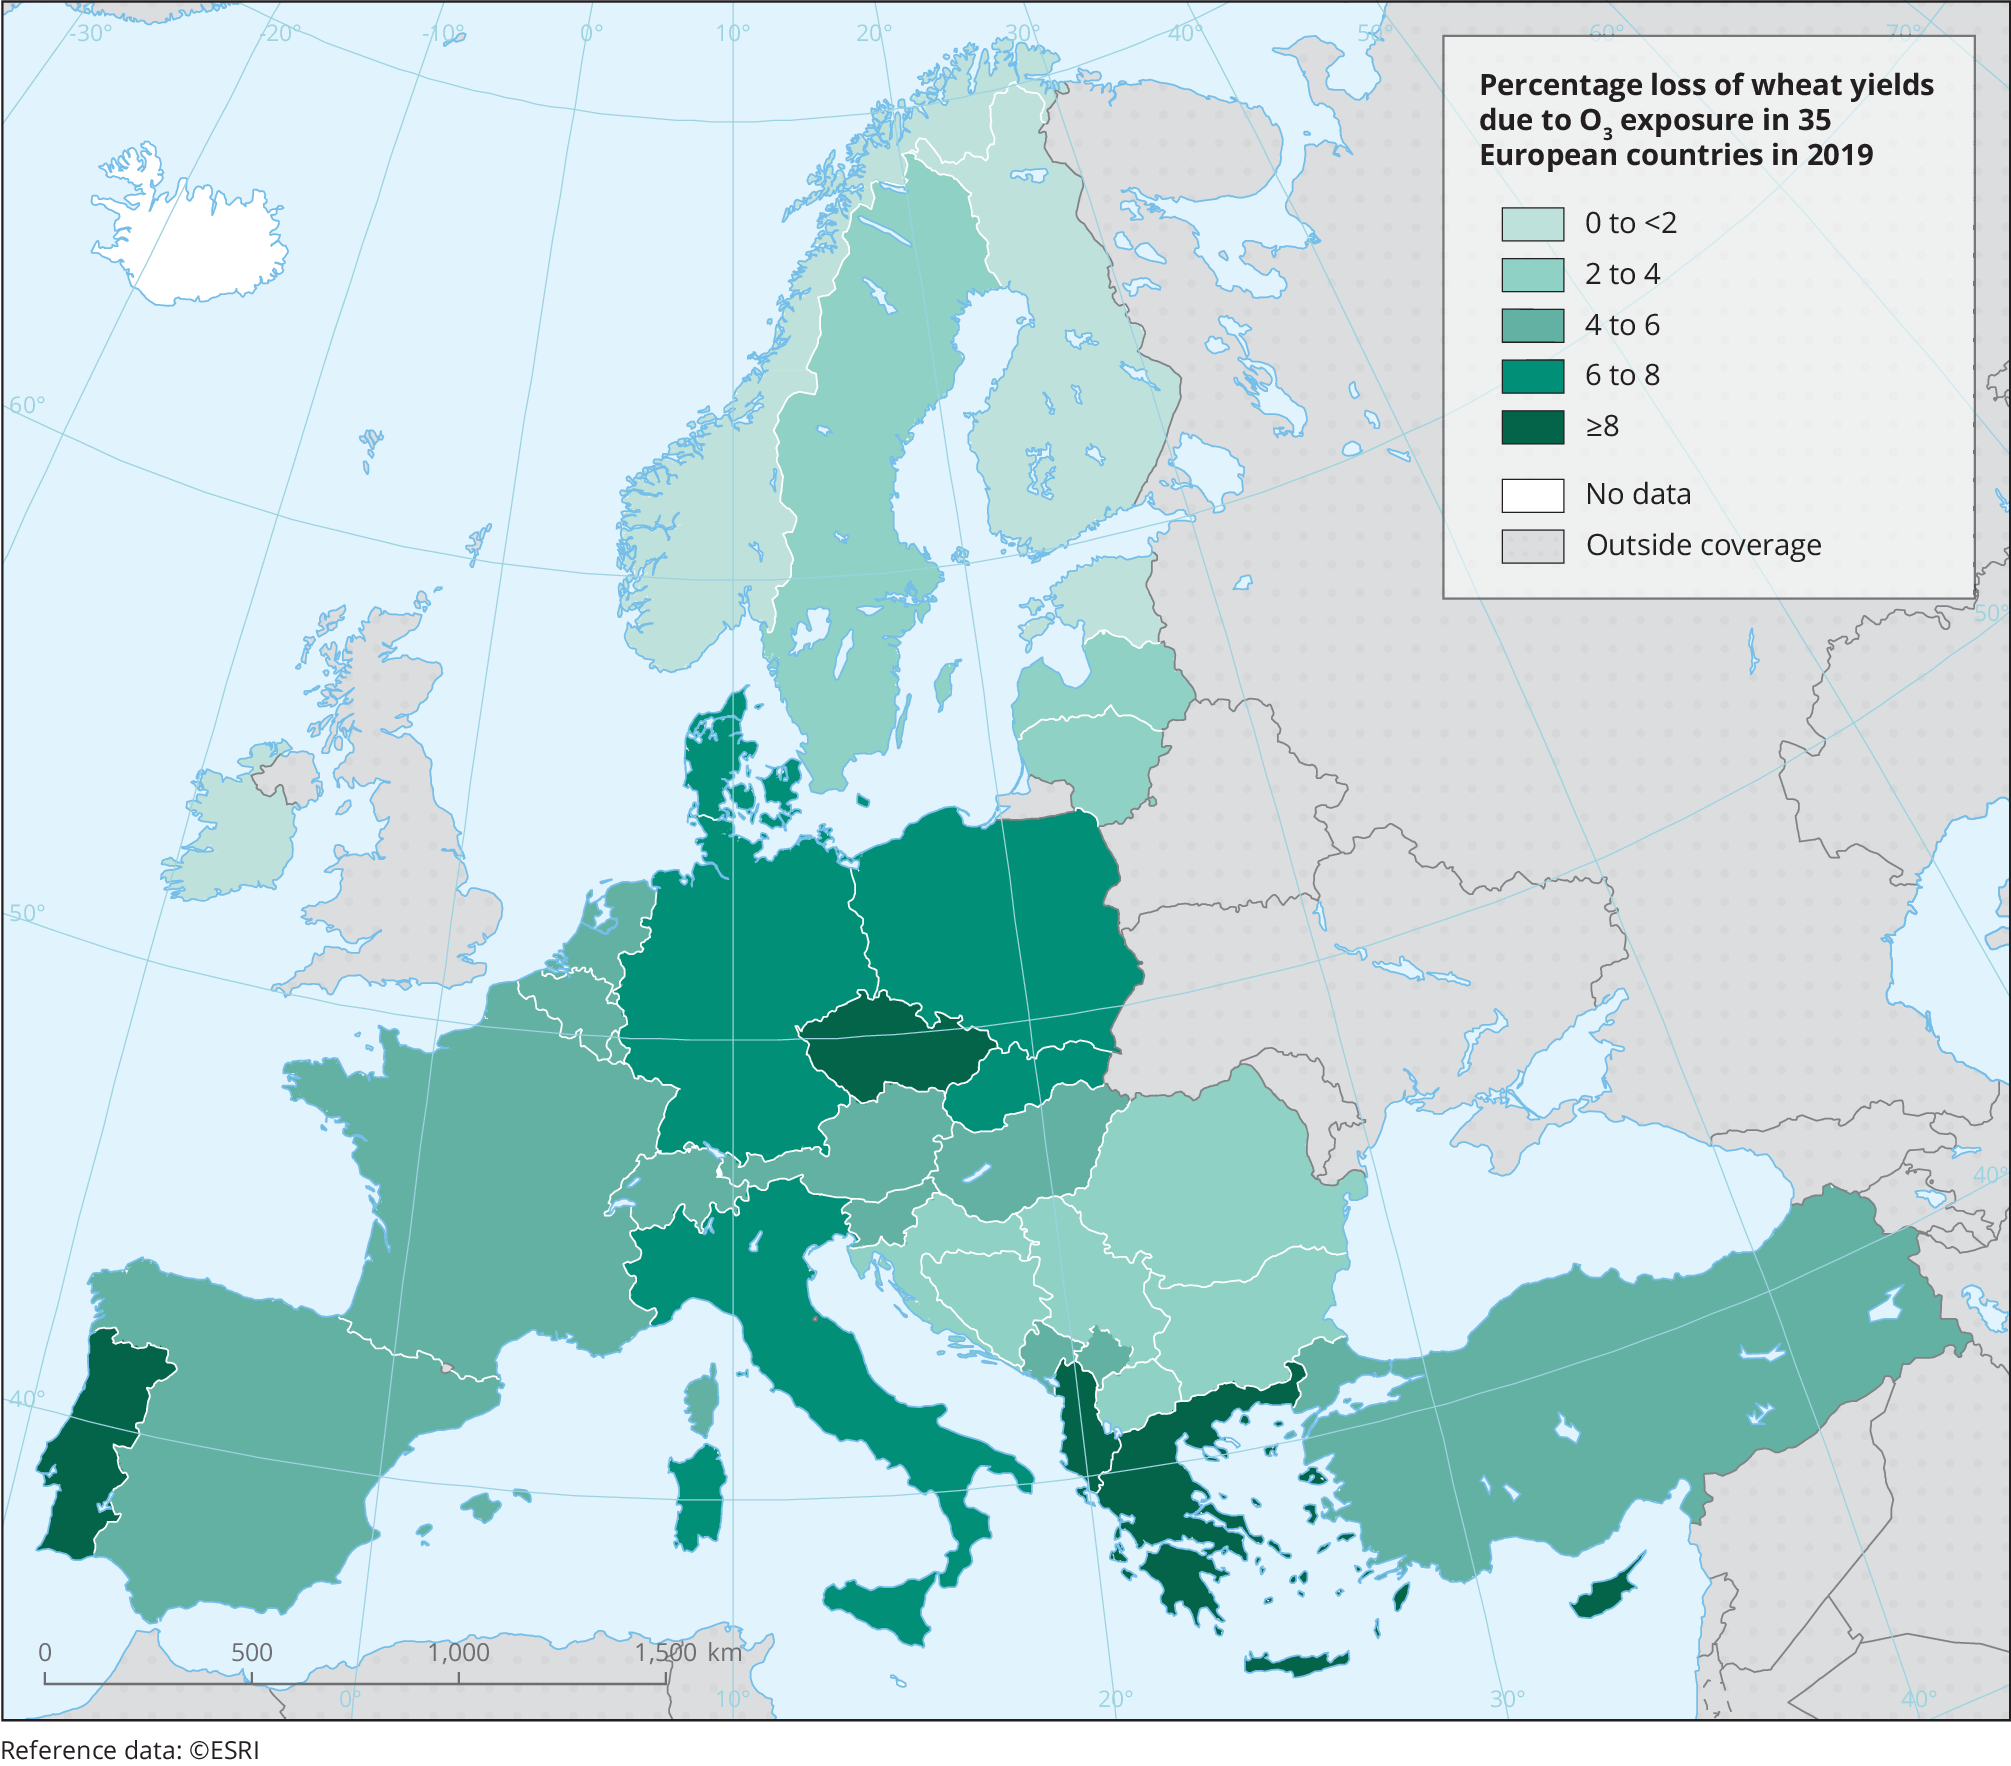
Ground-level O3 also damages agricultural crops and timber, affecting the quality and yield of production and resulting in significant economic losses for the sector. For the year 2019, this section presents losses in wheat yield due to O3 exposure as a percentage of yield as well as monetary losses in 35 countries across Europe.
Figure 3 presents the percentages of yield lost due to O3 exposure at the national level in 2019. Losses reached 9% of yield in Greece, with losses of between 8% and 9% in Albania, Cyprus, Czechia and Portugal. In 17 countries, the loss exceeded 5%.
Source: ETC/ATNI, 2021
Click here for different chart formats and data
In terms of economic losses due to the impacts of ground-level O3 on wheat yields, a different picture emerges. This is because the countries most affected are those with high overall wheat production (see Figure 4). Wheat yield losses were highest in France, reaching EUR 350 million, followed by EUR 280 million in Germany, EUR 140 million in Poland and EUR 130 million in Türkiye. In fact, most countries faced losses of several million euros. In total, EUR 1,418 billion was lost across all 35 countries (ETC/ATNI, 2021).
The unusual meteorological conditions in 2019 suggest that these impacts may be underestimated for those years in which conditions were average. While ozone levels were high as a result of higher temperatures, drought conditions across Europe meant that the amount of ozone taken in by plants was lower than in years with less severe droughts (ETC/ATNI, 2021).
Methods and data sources
The results presented here are based on the work of the European Topic Centre on Air Pollution, Transport, Noise and Industrial Pollution (ETC/ATNI), with the methodology described in its report on European wheat yield loss in 2019 due to ozone exposure (ETC/ATNI, 2021). The methodology was drawn from the manual for modelling and mapping critical loads and levels of the Air Convention (see ICP Vegetation, 2017a). It uses the phytotoxic ozone dose (POD) indicator to measure O3 damage to vegetation. The indicator takes into account temperature, light intensity and hydrological stress to which a plant is exposed in order to estimate the amount of O3 that enters the plant via the leaf surface above a threshold during a specified time or growth period. Study results based on the POD indicator show more consistency with observations of impacts of ozone on vegetation than those using the AOT40 metric (ICP Vegetation, 2017b).
In terms of data sources, Eurostat data on wheat production at level 2 of the Nomenclature of Territorial Units for Statistics (NUTS 2) were used. When not available, regional data were estimated from national production information, using the number of holdings by area category (ha) and by region as a proxy. Crop production data were then spatialised on a grid of 2 km × 2 km using Corine Land Cover land use classes. Wheat price data were obtained by dividing the gross production value for wheat from Faostat by the wheat production value from Faostat.
Eutrophication
Nitrogen is present in the air in the form of several key pollutants, including nitrogen monoxide (NO), nitrogen dioxide (NO2) and ammonia (NH3). The atmospheric deposition of nitrogen in terrestrial ecosystems can cause harmful eutrophication when critical loads are exceeded. The critical load refers to a threshold below which the ecosystem is able to absorb pollutants deposited from the atmosphere without disruption, while deposition above this threshold is likely to disrupt terrestrial and aquatic ecosystems and lead to changes in species diversity. Critical loads vary by ecosystem type, and overall exceedances are estimated using modelling methods.
In 2020, under the baseline scenario of the European Commissions’ Third Clean Air Outlook, critical loads for nitrogen deposition were exceeded in 75% of the total ecosystem area of the 27 Member States (EU-27), constituting 1,082,200km2 (Figure 5). This represents a fall of 12% since 2005. The zero pollution action plan has set a 2030 target of a 25% reduction from 2005 levels. Significant exceedances of critical loads for nitrogen were seen in the Po Valley (Italy), in the Dutch-German-Danish border areas and in north-eastern Spain.
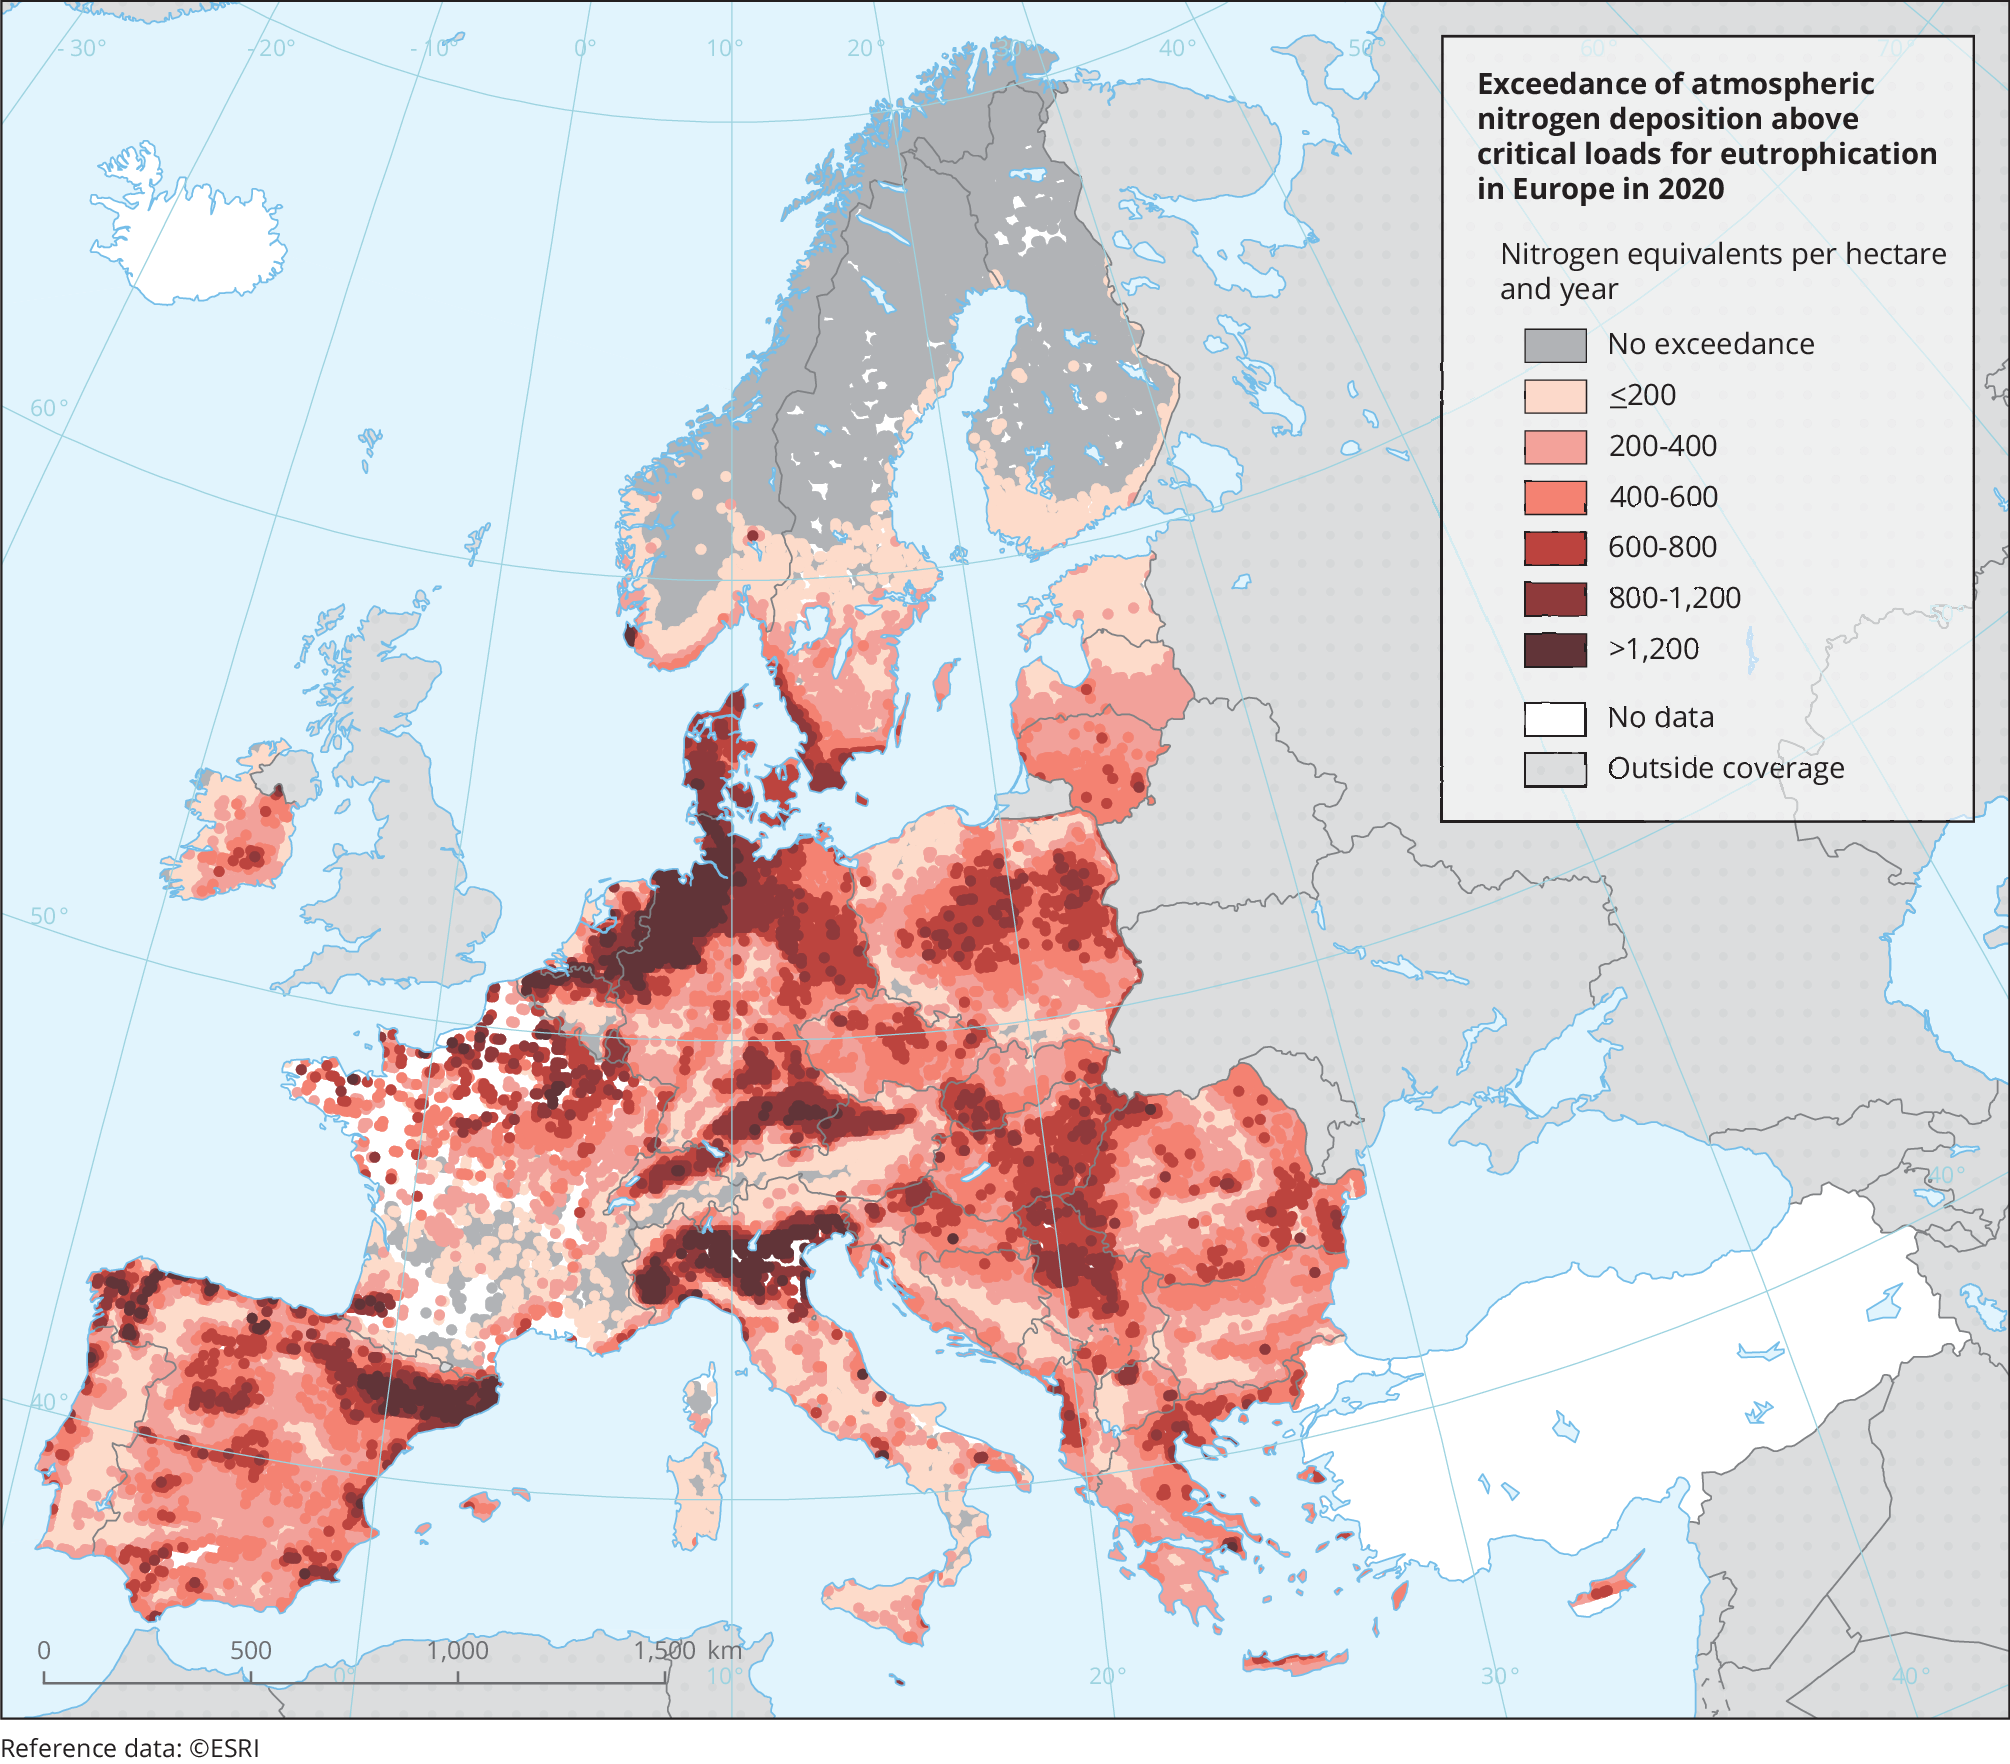
Notes: The map shows areas where critical loads are not exceeded (grey shading), indicating no risk of eutrophication, and where atmospheric nitrogen deposition exceeds critical loads by magnitude of exceedance.
Source: AIR008.
Click here for different chart formats and data
With regard to marine habitats, while nutrient loading in rivers is the primary cause of eutrophication problems, the contribution from air emissions is nonetheless significant.
Acidification
The deposition of sulphur dioxide (SO2), nitrogen oxides (NOX) and ammonia (NH3) leads to changes in the chemical composition of soils, lakes, rivers and marine waters, resulting in acidification. The impacts of low pH values on freshwater and forest soils include the release of toxic metals and the loss of nutrients, resulting in fish mortality and forest decline, respectively.
Significant decreases in emissions of SO2 over recent decades have successfully addressed the problem of acidification. The European Monitoring and Evaluation Programme (EMEP), which models deposition data, estimates that exceedances of critical loads for acidification were seen in 4% of the European ecosystem in 2020 (EMEP, 2022). Hotspots occurred in the Netherlands and its borders with Germany and Belgium and in small parts of southern Germany and Czechia. In these remaining hotspots, nitrogen deposition is usually the main driver of acidification.
Vegetation exposure to NOX and SO2
Vegetation exposure to NOX and SO2 can also be assessed on the basis of monitoring data reported to the EEA in accordance with the ambient air quality directive (EU, 2008).
Regarding NOX, the annual critical level for the protection of vegetation from exposure (an annual mean of 30μg/m3) was exceeded in 2020 at only 4 out of 360 reporting rural background stations: two in Italy and two in Türkiye (see EEA annual air quality statistics). In most of Europe, NOX levels are estimated to be below the critical level for the protection of vegetation. In 2020, however, annual mean NOX concentrations were estimated to be above the critical level for the protection of vegetation in the Po Valley in Italy, the southern part of the Netherlands, northern Belgium, the German Ruhr region and a few rural areas close to major cities (ETC/EH Eionet report 2022/12).
Regarding SO2, the critical level of an annual mean of 20μg/m3 was not exceeded at any of the 254 rural background stations that reported data for 2020. The critical level for winter was also not exceeded at any of the 248 rural background stations that reported these data (see EEA annual air quality statistics).
Heavy metals
Heavy metals emitted to air are transported long distances in the atmosphere and deposited into ecosystems. Heavy metals are toxic and their persistence in ecosystems leads to their bioaccumulation in the food chain. In addition, the deposition of heavy metals in marine waters contributes to the presence of metals in marine organisms (EEA, 2019b).
The deposition flux (meaning both wet and dry deposition) of lead, cadmium and mercury in high-vegetation areas, such as forests, is several times higher than that in low-vegetation areas, such as croplands (EMEP, 2022). In addition, the contribution of dry deposition to total deposition is higher for forested areas than for other ecosystems.
In 2020, the highest fluxes of lead deposition were estimated in the southern part of Poland, the north-western part of Germany and northern Italy, while the lowest were seen over the Scandinavian peninsula and Finland (EMEP, 2022).

Document Actions
Share with others