Indicator 13: Transport infrastructure investment
- Transport infrastructure investment in the
EU grew by 28 % in the period 1987-1995. After peaking in 1992,
it has since fallen by 3 % per year.
- Since 1987 the overall modal investment shares
have remained almost unchanged, dominated by a road share of 62 %
and rail share of 27 %.
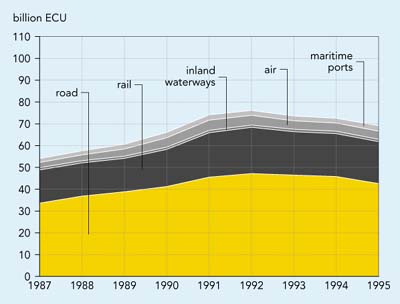
Figure 4.4:	Investments in transport infrastructureEU
(1995 prices)
Source: European Conference of Ministers
of Transport (1999)
Objective
Give investment priority to environment-friendly transport systems.
Definition
Investment in transport infrastructure by mode.
Note: The investment shares of each transport
mode show the modal and environmental policy priorities of EU Member States.
|
Policy and targets
The TEN investment plan (estimated to exceed
EUR 400 bn up to 2010) is intended to have a 60 % rail, 30 % motorway
and 10 % other split, with rail investment mainly for the high-speed network
(CEC, 1998).
Financing from national budgets accounts for
the majority of TEN investments. However, EU financial contributions
to projects of common interest in the framework of TEN are important stimulants.
The Commission also encourages Public Private Partnerships in these projects.
The European Investment Bank (EIB) is an important
financier of transport infrastructure. In 1997; it borrowed EUR 6 879
m for projects in the transport sector alone. Roads and motorways received 43 %
of the investments, while 28 % were allocated to the railway network and
29 % to air transport and shipping (Eurostat, 1999).
Findings
Transport infrastructure investment increased steadily
from 1985 to 1992, but fell by 3 % per year from 1993 to 1995. Although
subsequent data is not available, there are indications of a modest increase
in recent years.
The rise from 1985 to 1992 resulted from a number of
major developments, including:
- the British Channel Tunnel;
- high-speed rail programmes in France, Germany and
Spain;
- accession of Spain and Portugal to the Community
(both countries launching major infrastructure programmes);
|
Box 4.2: Trans European Transport Network (TEN) investments
The multi-modal TEN plans include the development (by 2010) of the following
networks:
- TENroads: 27 000 km of planned roads (of which around 54 %
will be upgrades and 46 % new roads);
- TENrail: 10 000 km of new high-speed rail track and 14 000
km of conventional rail to be upgraded to high speed rail;
- TENinland waterways and inland ports: improvements to 42 sections
of inland waterways and to inland ports providing intermodal transhipment
points,
- TENmaritime ports: a proposal to integrate ports and terminals
intermodal connection points for transhipment between different transport
modes (COM (97) 681).
- TENairports: 30 International Connecting Points, some 60 Community
Connecting Points, and 200 Regional airports.
- TENcombined transport: 14 projects. Seven of these involve expansion
or upgrading, including notably the Betuwe rail freight line in the
Netherlands.
- The TEN guidelines also provide for investment in telematics infrastructure
for traffic management and information services.
Financing from national budgets accounts for the majority of TEN investments.
However, EU financial contributions to projects of common interest
in the framework of TEN are important stimulants. Some of the key conclusions
of the Commissions 1998 report on the implementation of the TEN report
(relating to 96/97 investments) are:
- Estimated cost to completion in 2010 is more than EUR 400 bn;
- The implementation of the network is far advanced: investments on
road, rail and inland waterway projects that are currently under development
amount to EUR 307.4 bn, some two thirds of the total amount envisaged;
- Total investment in 1996-7 amounted to EUR 38.4 bn (with EUR 12.6
bn support from Community funds and the EIB). The distribution was 38 %
on roads , 39 % on rail, and 15 % on airports.
- Over the same period, funding through the Cohesion fund, the European
Regional Development Fund, TEN was more biased towards road: 54 %
on road, 39 % on rail, 4 % airports.
- Two thirds of rail investment was devoted to high-speed lines (new
lines and upgrading of conventional lines).
Source: CEC, 1998
|
The decline from 1993 was for several reasons:
- economic growth slowed after 1990, which affected
all investments;
- increasing concern for environmental impact led to
higher costs which in turn led to a switch of expenditure from investment
to non-investment projects (ECMT 1999);
- the completion of some major projects;
- the impact of the Maastricht criteria and the accompanying
pressure on deficits and public spending.
Investment trends in infrastructure after 1993 varied
across the Member States. There was a severe decline in Finland, Germany, Italy
and the UK, but an increase in Belgium, Sweden and Portugal. Belgiums investment
was dominated by construction of the high-speed railway, and Portugals by investment
projects associated with the universal exhibition in 1998.
In 1995 investment in transport infrastructure (road,
rail, inland waterway, airports and maritime ports) was around EUR 69 bn. The
modal shares were 62 % roads, 28 % rail, airports 5.4 %, 3.6 %
maritime and 1.6 % inland waterways. The proportions of road and rail investment
have not changed significantly since 1987.
Figure 4.5: Infrastructure investment trends, EU,1987-1995
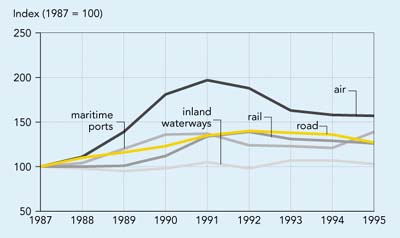
Source: European Conference of Ministers of Transport (1999)
Road investment in 1992 was 40 % higher than in
1987 thereafter it declined. By 1995 it was just 27 % above the 1987
figure. The allocation of investment to transport modes reflects road transports
dominant share of demand. In 1997, road transport accounted for more than 80 %
of passenger demand and 45 % of freight demand.
In 1995 rail investment was also 27 % higher than
in 1987, but in the intervening years investment levels were consistently lower
than those for road. Much of the rail investment programme was devoted to HSR
construction in France, Germany, and Spain.
Although maritime ports play an important role,
investment declined through the 1970s and 1980s. However, since 1990 investment
has grown, and by 1995 was 39 % higher than in 1987. Nevertheless, investment
in ports remains low compared with that in other transport modes.
Airport investment shows the highest increase over the
period 1987-1995 (57 %). This increase reflects the rapid growth in air
traffic.
Comparing transport investment with GDP and population
(in 1995):
- Sweden had the highest at 1.5 % of GDP with
Portugal second at 1.4 % of GDP;
- Austria and Denmark had the lowest at 0.6 %
of GDP each;
- per capita, the highest levels were found in Luxembourg,
Germany and Sweden.
Future work
- Infrastructure investment data should include both
publicly and privately financed projects. However, investments by local authorities
are often excluded from public investment figures, as are some private investment
projects. Investment data is therefore not comparable between countries.
- More work is needed at the EU level to ensure standardisation
and reliability.
- No reliable data is available on investment in coastal
shipping, urban public transport infrastructure or combined transport.
|
Data
Transport infrastructure investments
Unit: EUR/capita (1995 prices)
|
| |
1990
|
1991
|
1992
|
1993
|
1994
|
1995
|
Investments as % of GDP in 1995
|
|
Austria
|
230
|
203
|
187
|
196
|
170
|
132
|
0.6
|
|
Belgium
|
143
|
166
|
196
|
226
|
230
|
215
|
1.1
|
|
Denmark
|
151
|
138
|
153
|
157
|
162
|
155
|
0.6
|
|
Finland
|
231
|
238
|
251
|
225
|
232
|
223
|
1.1
|
|
France
|
230
|
251
|
252
|
241
|
229
|
220
|
1.0
|
|
Germany
|
200
|
284
|
297
|
281
|
285
|
284
|
1.3
|
|
Greece
|
47
|
49
|
58
|
71
|
51
|
65
|
0.8
|
|
Ireland
|
84
|
96
|
99
|
134
|
115
|
128
|
1.0
|
|
Italy
|
169
|
166
|
170
|
148
|
126
|
100
|
0.7
|
|
Luxembourg
|
309
|
434
|
485
|
465
|
411
|
388
|
1.1
|
|
Netherlands
|
161
|
163
|
166
|
170
|
182
|
184
|
0.9
|
|
Portugal
|
66
|
69
|
81
|
77
|
95
|
106
|
1.4
|
|
Spain
|
181
|
194
|
178
|
176
|
174
|
147
|
1.3
|
|
Sweden
|
174
|
156
|
168
|
208
|
246
|
301
|
1.5
|
|
United Kingdom
|
172
|
163
|
167
|
158
|
160
|
146
|
1.0
|
|
EU15
|
181
|
202
|
207
|
199
|
196
|
186
|
1.1
|
Sources: ECMT (investments) and Eurostat (population)

Document Actions
Share with others