3. SUMMARY OF REPORTED
DATA FOR 1995
The location of monitoring stations used
for the implementation of the ozone directive and reporting
during 1995 is presented in Map 1. In total information for 858
stations has been received. All Member States use the reference
method (UV absorption) as prescribed in Annex V of the Ozone
Directive, however, at a limited number of stations
chemiluminescence is used.
A summary of the maximum concentration
measured at any of the reporting stations when exceedance of a
threshold value is observed is presented in Table 3. When no
exceedances of a threshold have been reported by a country this
is indicated with a dash (-).
Exceedance of the threshold value of 360
µg/m3 for hourly values has been observed at one station only:
| Country |
Stationname &
City |
Date, time |
Max conc (µg/m3) |
| Portugal |
Coimbra |
26 April
1995, 4.00 |
365 |
|
Table 3. Maximum ozone concentrations
(in µg/m3) measured during a period of exceedance of threshold
values (reference period 1 January - 31 December 1995). A dash
(-) indicates that no exceedances have been observed at any of
the monitoring stations in the Member State. A question mark (?)
indicates that exceedances are observed but no information on
maximum values is available.
| |
180 |
200 |
360 |
110 |
110 |
65 |
| |
1h |
1h |
1h |
8h (a) |
8h (b) |
24h |
| AT |
260 |
260 |
- |
190 |
209 |
166 |
| BE |
284 |
284 |
- |
242 |
243 |
187 |
| DE |
293 |
293 |
- |
227 |
245 |
203 |
| DK |
202 |
202 |
- |
179 |
191 |
142 |
| ES |
292 |
292 |
- |
164 |
189 |
155 |
| FI |
- |
- |
- |
131 |
136 |
122 |
| FR |
319 |
319 |
- |
234 |
233 |
177 |
| GB |
268 |
268 |
- |
244 |
246 |
205 |
| GR |
352 |
352 |
- |
155 |
243 |
142 |
| IE |
232 |
232 |
- |
175 |
174 |
143 |
| IT |
300 |
338 |
- |
227 |
258 |
175 |
| LU |
253 |
253 |
- |
190 |
204 |
167 |
| NL |
279 |
279 |
- |
195 |
224 |
143 |
| PT |
365 |
365 |
365 |
? |
? |
173 |
| SE |
206 |
206 |
- |
183 |
194 |
140 |
|
(a) based on three non-overlapping eight
hourly values between 0.00-8.00; 8.00-16.00; 16.00-24.00;
(b) based on the eight hourly value between 12.00-20.00.
This exceedance has been
observed in a period during which exceedances of the 180 µg/m3
threshold have not been reported at any other station in the EU.
An explanation of this exceptional level (e.g. local ozone
formation, intrusion of stratospheric ozone or malfunc-tioning of
the monitoring system) cannot be made without further information
on local conditions at the time of exceedance. This study is
currently being carried out by Portugal.
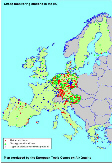 |
Map 1. Location of
ozone monitoring stations as reported by Member States in
the framework of the Ozone Directive for the reference
period 1995. |
As the number of monitoring stations
differs widely from country to country, the absolute number of
exceedances is less suitable for comparison. Therefore, the
concept of "occurrence of exceedances" is introduced
here. Occurrence of exceedances is defined as the averaged number
of observed exceedances per country, that is, the total number of
exceedances summed over all the stations of a country divided by
the total number of reporting stations. A summary of occurrence
of exceedances is presented in Table 4. Full details on the
number of exceedances at the individual stations is presented in
Table I.1 of Annex I.
The longest period of consecutive days on
which thresholds were exceeded and the average length of an
exceedance period are presented in Tables I.2 and I.3 of Annex I.
For each of the Member States the lowest
and highest 50-, 98- and 99.9-percentile values observed at
individual stations with a data-coverage of 75% or more, are
presented in Table 5. In this table also information on the
maximum values is included. Note that the maximum 8-hourly
concentration, as reported in Table 5 is based on a moving
average and may therefore differ from the values in Table 3 which
are based on fixed 8-hourly periods. Detailed information on the
percentile values and maximum concentrations observed at
individual monitoring stations is given in Annex I, Table I.4.
Table 4. Occurrence of exceedances
(reference period 1 January - 31 December 1995);
n.a. = no information available.
| |
Number of stations
(c) |
180
1h |
200
1h |
110
8h (a) |
110
8h (b) |
65
24h |
| AT |
110 |
1.2 |
0.3 |
33.6 |
38.7 |
111.3 |
| BE |
20 |
10.6 |
4.9 |
24.7 |
30.4 |
45.6 |
| DE |
342 |
5.3 |
2.2 |
24.4 |
33.4 |
73.3 |
| DK |
6 |
1.0 |
0.3 |
6.8 |
11.5 |
103.8 |
| ES |
86 |
0.5 |
0.2 |
11.3 |
12.9 |
52.7 |
| FI |
11 |
0.0 |
0.0 |
3.5 |
4.8 |
116.0 |
| FR |
110 |
3.4 |
1.4 |
20.3 |
20.3 |
40.3 |
| GB |
32 |
3.1 |
1.3 |
10.8 |
13.8 |
58.4 |
| GR |
10 |
18.5 |
10.2 |
9.9 |
53.8 |
103.2 |
| IE |
6 |
2.2 |
1.0 |
15.0 |
14.3 |
117.5 |
| IT |
68 |
5.5 |
2.9 |
22.8 |
28.9 |
45.6 |
| LU |
5 |
8.6 |
2.6 |
33.0 |
31.0 |
77.8 |
| NL |
37 |
6.9 |
3.7 |
14.5 |
25.5 |
44.5 |
| PT |
9 |
2.3 |
1.5 |
n.a. |
n.a. |
51.9 |
| SE |
6 |
0.3 |
0.2 |
10.8 |
11.3 |
138.7 |
| EU-15 |
858 |
4.1 |
1.8 |
22.1 |
28.3 |
70.1 |
|
(a) based on three non-overlapping eight
hourly values between 0.00-8.00; 8.00-16.00; 16.00-24.00;
(b) based on the eight hourly value between 12.00-20.00;
(c) note that small differences in the number of stations
reporting for each of the threshold levels may occur.
A further discussion on the reported data
for 1995 is given in the following chapters. A short comparison
between the ozone levels in 1994 and 1995 will be given in
paragraph 4.5. Percentile values for previous years (1989-1995)
have been reported by four Member States and are briefly
discussed in paragraph 4.6.
Table 5. Range in reported 50-, 98- and
99.9-percentile values and maximum observed values (based on
hourly and moving eight-hourly averaged concentrations) observed
at individual monitoring stations in Member States (in µg/m3),
period 1 January - 31 December 1995; n.a.= no information
available.
| 1995 |
1h-P50 |
1h-P98 |
1h-P99.9 |
1h-MAX |
| range |
min |
max |
min |
max |
min |
max |
min |
max |
| AT |
9 |
96 |
88 |
153 |
117 |
201 |
128 |
260 |
| BE |
27 |
50 |
126 |
167 |
187 |
235 |
214 |
284 |
| DE |
9 |
92 |
70 |
182 |
113 |
242 |
148 |
293 |
| DK |
45 |
63 |
104 |
112 |
156 |
183 |
177 |
202 |
| ES |
11 |
78 |
34 |
141 |
56 |
232 |
62 |
292 |
| FI |
34 |
70 |
79 |
116 |
100 |
133 |
109 |
147 |
| FR |
13 |
81 |
70 |
170 |
112 |
265 |
30 |
319 |
| GB |
14 |
68 |
72 |
160 |
116 |
244 |
28 |
268 |
| GR |
18 |
59 |
79 |
173 |
101 |
275 |
110 |
352 |
| IE |
48 |
72 |
100 |
125 |
n.a. |
n.a. |
160 |
233 |
| IT |
7 |
69 |
64 |
179 |
107 |
246 |
95 |
338 |
| LU |
16 |
62 |
87 |
167 |
149 |
210 |
178 |
253 |
| NL |
17 |
53 |
86 |
153 |
164 |
232 |
175 |
279 |
| PT |
10 |
90 |
32 |
137 |
57 |
227 |
81 |
365 |
| SE |
57 |
67 |
93 |
117 |
115 |
183 |
122 |
206 |
|
| 1995 |
8h-P50 |
8h-P98 |
8h-P99.9 |
8h-MAX |
| range |
min |
max |
min |
max |
min |
max |
min |
max |
| AT |
13 |
95 |
81 |
148 |
109 |
183 |
119 |
211 |
| BE |
27 |
55 |
114 |
152 |
168 |
219 |
184 |
251 |
| DE |
15 |
91 |
62 |
177 |
104 |
232 |
130 |
267 |
| DK |
45 |
63 |
98 |
107 |
139 |
168 |
164 |
189 |
| ES |
11 |
77 |
31 |
138 |
47 |
159 |
41 |
188 |
| FI |
34 |
70 |
74 |
113 |
91 |
131 |
99 |
137 |
| FR |
14 |
81 |
65 |
155 |
94 |
225 |
28 |
241 |
| GB |
16 |
68 |
66 |
156 |
102 |
238 |
24 |
252 |
| GR |
20 |
59 |
72 |
155 |
89 |
223 |
98 |
259 |
| IE |
47 |
71 |
94 |
120 |
n.a. |
n.a. |
145 |
190 |
| IT |
44 |
44 |
146 |
146 |
n.a. |
n.a. |
66 |
244 |
| LU |
19 |
62 |
77 |
164 |
131 |
200 |
146 |
205 |
| NL |
19 |
53 |
79 |
140 |
141 |
214 |
156 |
227 |
| PT |
10 |
91 |
30 |
144 |
54 |
205 |
61 |
226 |
| SE |
56 |
67 |
90 |
114 |
112 |
171 |
114 |
194 |
|


Document Actions
Share with others