7. NITROUS OXIDE - N2O
7.1 N2O-emissions by countries
The 1990 annual total N2O-emissions for
EUROPE were estimated to be 1.9 million tonnes. These emissions broken down by EU-12,
EFTA-5 and PHARE-10 countries are shown in figure 7.1. The largest contributor were the
EU-12 countries with 69%, second largest the PHARE-10 countries with 24%; the EFTA-5
countries contributed 5% and Germany (former East) and Malta 2%.
Figure 7.1: Contribution in % to the EUROPEAN total
N2O-emissions
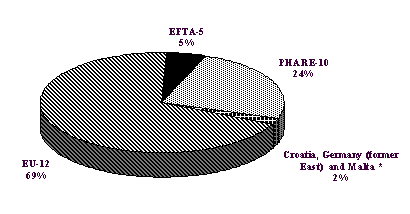
*) Croatia not yet
available
Figure 7.2 shows the relative contribution of
individual countries to the total of 1.9 million tonnes. In 1990 the largest contributing
countries were France (12%), Spain and Greece (each 11%); the smallest contributing
countries were Malta (0.004%), Luxembourg (0.04%), Estonia (0.2%) and Austria (0.4%).These
differences are due to different size of population, different per capita emissions (see
also paragraph 7.3) and differences in
emissions from natural sources.
Figure 7.2: Contribution in % of each country to the
EUROPEAN total N2O-emissions
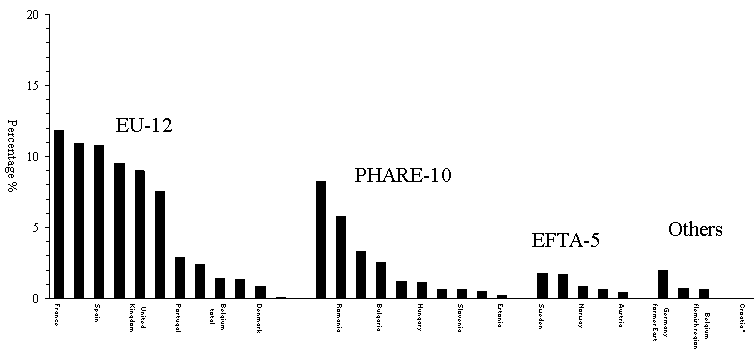
*) Croatia not yet available
7.2 N2O-emissions per group
More than two thirds of the N2O-emissions
for EUROPE resulted together from agriculture (group 10, 39%) and nature (group 11, 29%)
in 1990. Group 4 (production processes) contributed with 19% and group 1 (public power,
cogeneration and district heating) with 5% to the N2O-emissions. Group 2
(commercial, institutional and residential combustion), group 3 (industrial combustion),
group 7 (road transport) and group 9 (waste treatment and disposal) produced the remaining
8% of the N2O-emissions in EUROPE. Other groups were not relevant for N2O-emissions.
The split of the N2O-emissions into
groups for EU-12 countries, PHARE-10 countries and EFTA-5 countries is quite similar
compared to the split for EUROPE with the exception of the larger contribution of group 1
(public power, cogeneration and district heating; 9%) and group 10 (agriculture; 53%) in
the PHARE-10 countries as well as of group 4 (production processes; 24%) in the EU-12
countries and the smaller contribution of group 4 (7%) in the PHARE-10 countries.
The differences of contributions especially of the
main source groups 11, 10, 4 and 1 to the total emissions are larger between countries
than these groups (see also table 7.1). The relative contribution of the N2O-emissions
of group 11 (nature) ranges from 88% (Greece) to 0% (Norway, Hungary, Malta and United
Kingdom), of group 10 (agriculture) from 88% (Ireland and Lithuania) to 6% (Greece), of
group 4 (production processes) from 53% (Germany former West) to 0% (Denmark and others)
and of group 1 (public power, cogeneration and district heating) from 16% (Belgium,
Flemish region) to 0% (the Netherlands, Norway and Switzerland).
However it is evident from these differences in the
relative contribution of sourcegroups to a countries total emissions that strategies for
reduction of N2O-emissions need individual solutions as well as common
elements.
Figure 7.3: Contribution in % of source groups to
the EUROPEAN N2O-emissions
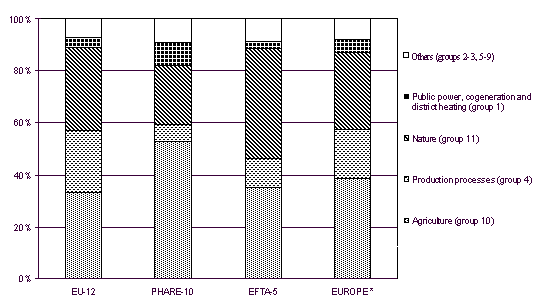
*) Croatia not yet
available
7.3 N2O-emissions
per capita
Only anthropogenic emissions are expected to be
related to population for these calculations. Therefore group 11 (nature) has been
excluded.
For EUROPE the average N2O-emissions per
capita were 3 kg/capita. Compared to this number the per capita N2O-emissions
were equal for the EU-12 countries with 3 kg/capita, 33% smaller for the EFTA-5 countries
with 2 kg/capita and equal for the PHARE-10. This comparison is also shown in figure 7.4
and table 9.
Significant different to the average of EUROPE are
the per capita N2O-emissions in Ireland with 12 kg/capita. The smallest per
capita N2O-emissions were in Malta with 0 kg/capita, Austria and the
Netherlands with 1 kg/capita (see figure 7.5). In most of the countries the per capita N2O-emissions
are between 2 kg/capita and 4 kg/capita. The smallest per capita emissions is a factor of
larger than 12 smaller compared to the largest number.
Figure 7.4: N2O-emissions per capita for
EUROPE
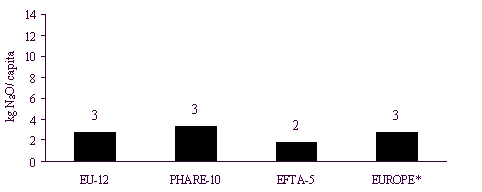
*) Croatia not yet available
Figure 7.5: N2O-emissions per capita for
individual countries
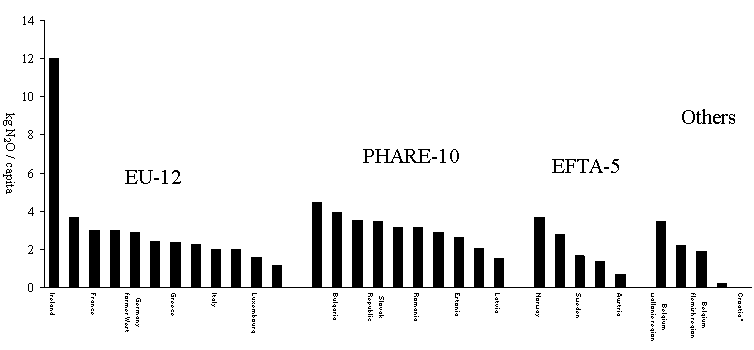
*) Croatia not yet available
7.4 N2O-emissions per km2
The emissions per km2 have been
calculated from the total emissions, the emissions of group 11 (nature) having been
included in this case.
For EUROPE the average N2O-emissions per
km2 were estimated as 397 kg/km2. Compared to this number the per km2
N2O-emissions were 44% larger for the EU-12 countries with 570 kg/km2,
7% larger for the PHARE-10 countries with 426 kg/km2 and 80% smaller for the
EFTA-5 countries with 81 kg/km2. This comparison is also shown in figure 7.6
and table 10.
Figure 7.6: N2O-emissions per km2
for EUROPE
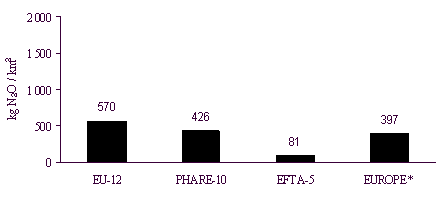
*) Croatia not yet available
Again the differences are much larger if individual
countries are compared: the largest N2O-emissions per km2 were for
Greece (1 555 kg/km2) and the next largest ones for Belgium, Flemish region
(926 kg/km2), Belgium, Wallonie region (810 kg/km2) and Czech
Republic (789 kg/km2). The smallest emissions per km2 for N2O
were for Norway (48 kg/km2), Sweden (73 kg/km2) and Finland (94
kg/km2). Figure 7.7 shows the countries ranked according their N2O-emission
per km2. The differences in the emissions per km2 between countries
are much larger compared to the per capita emissions. The smallest number being 32 times
smaller than the largest number.
Figure 7.7: N2O-emissions per km2
for individual countries
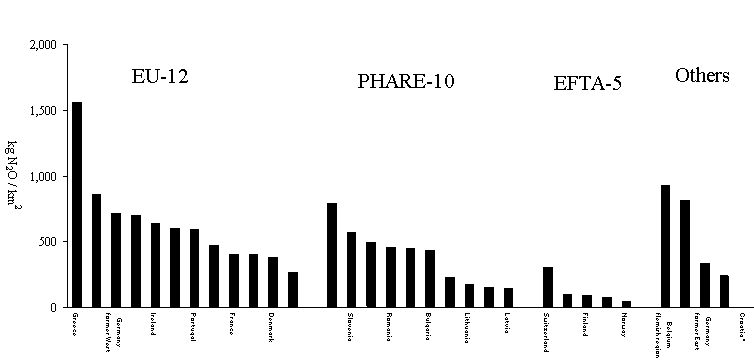
*) Croatia not yet available
Table 7.1: Nitrous oxide
emissions per country and group


Document Actions
Share with others