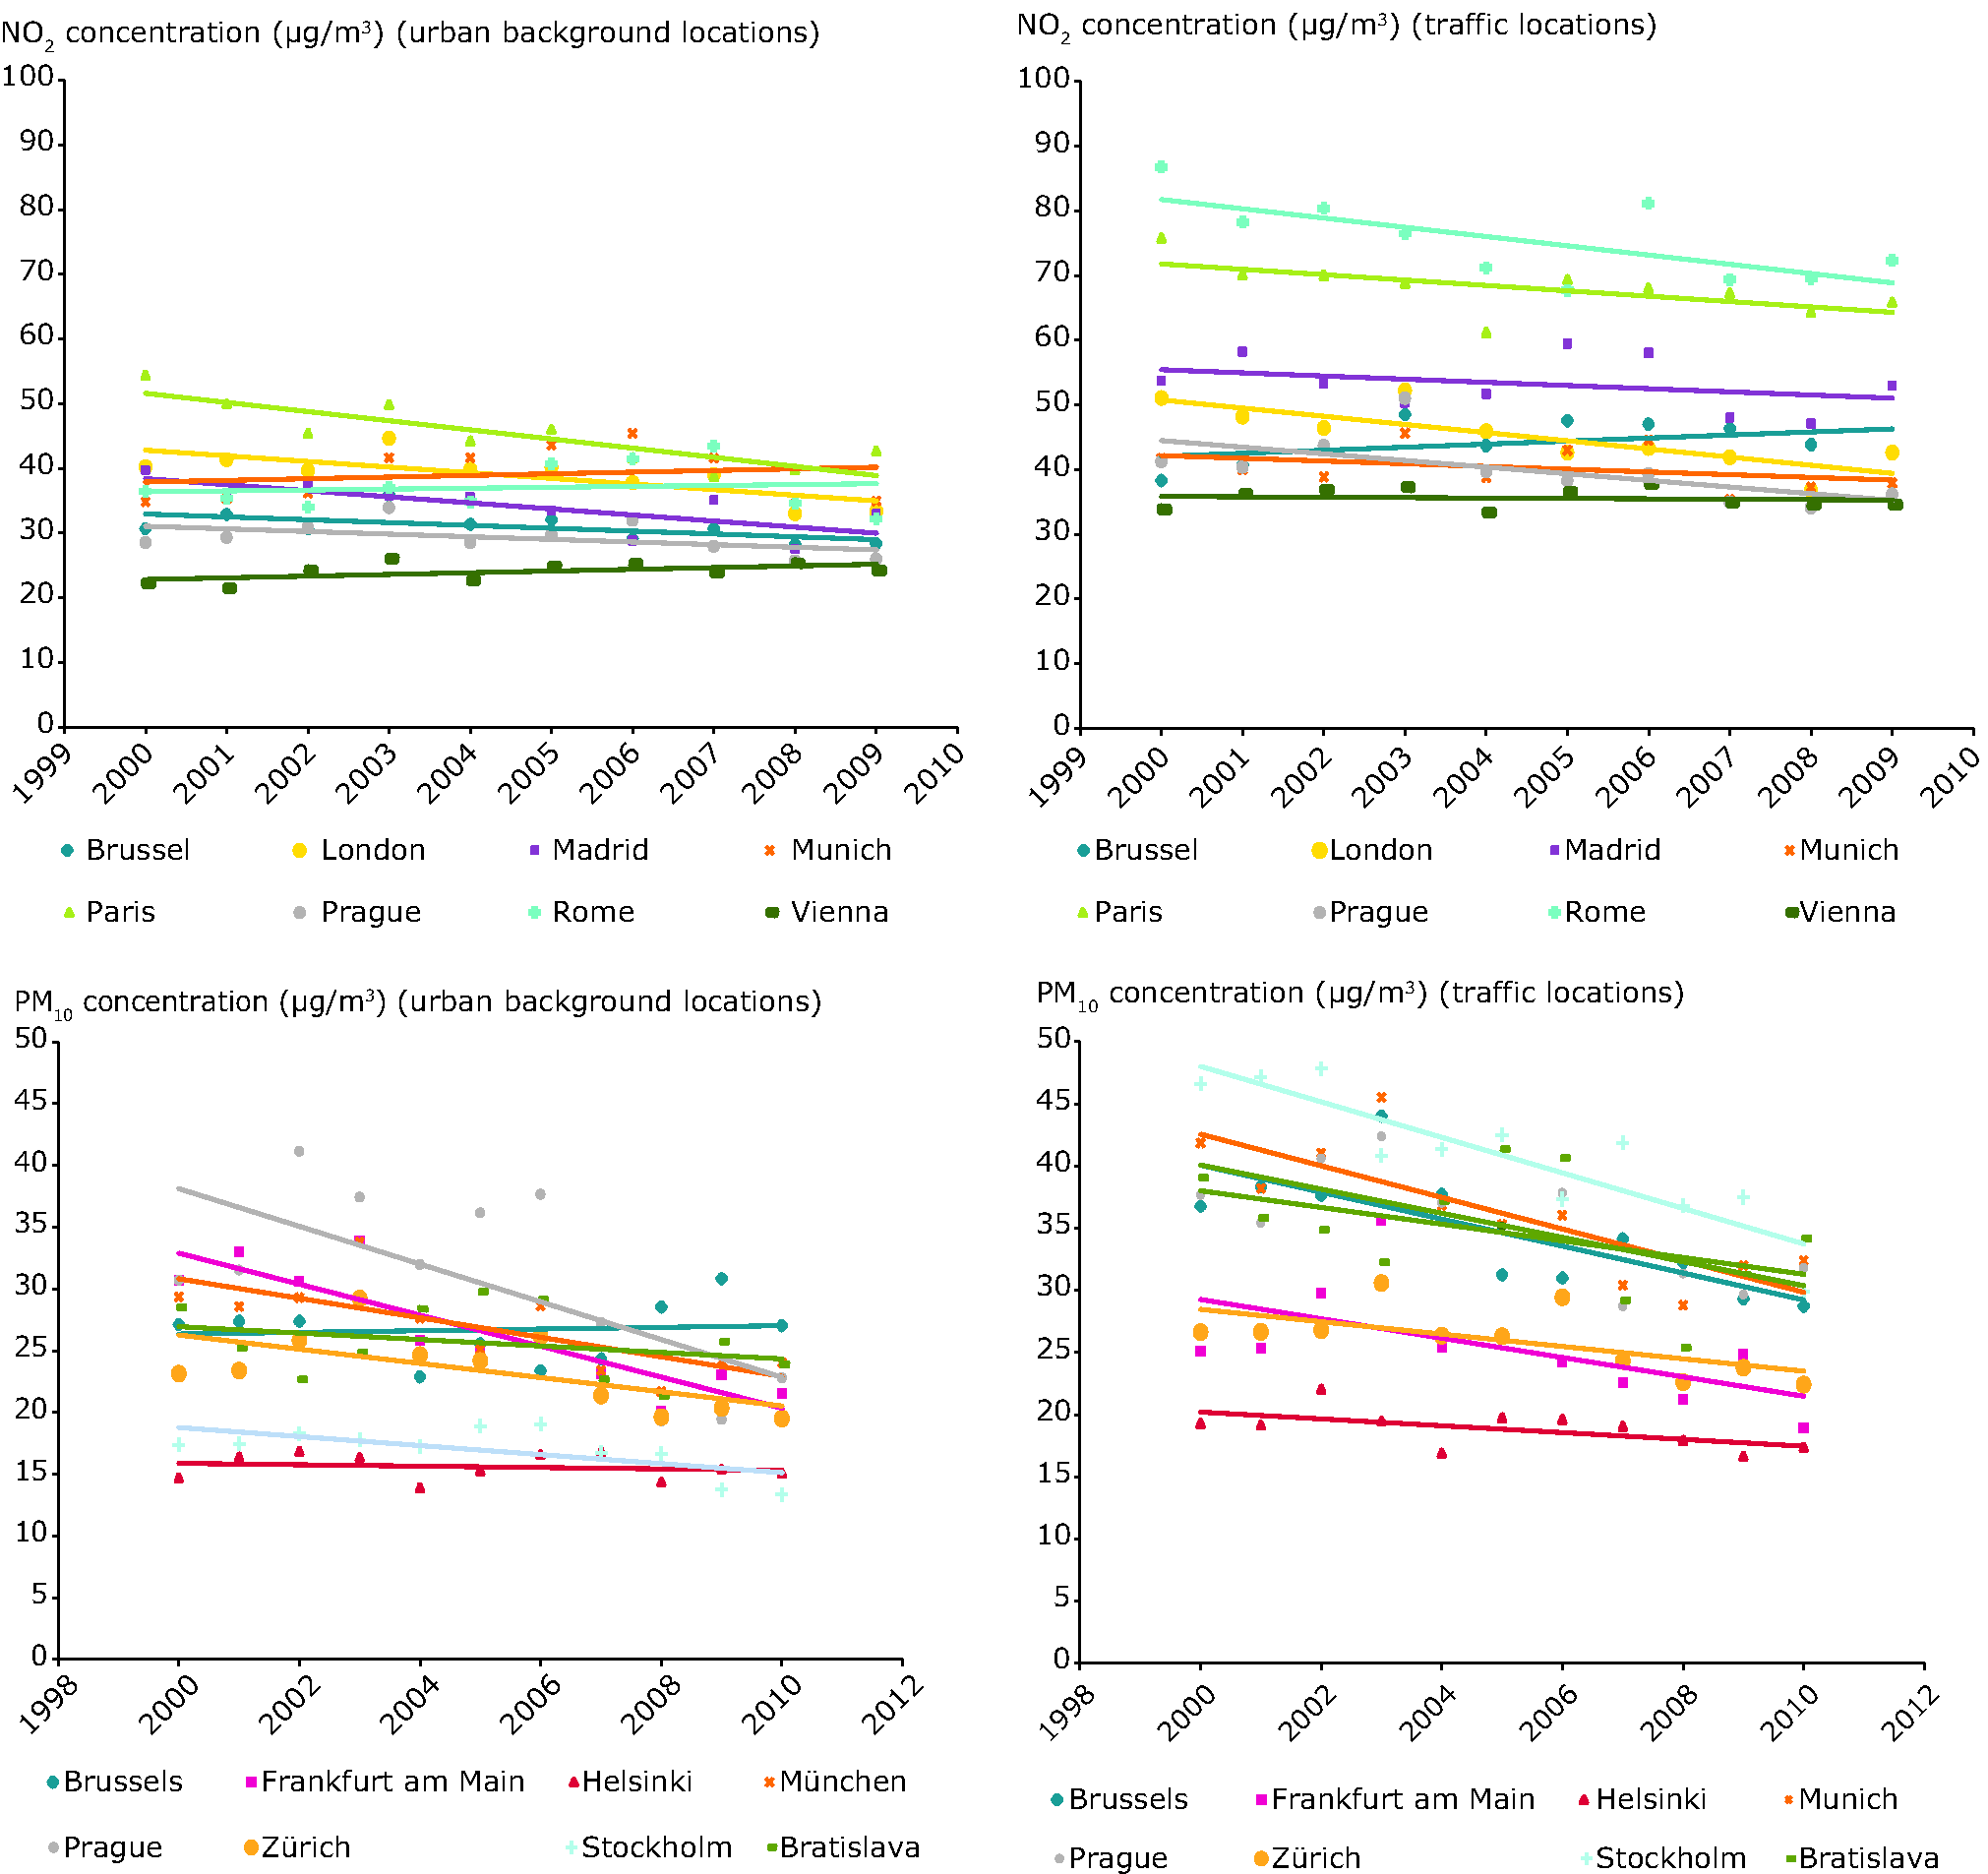
Top: NO2 concentration in selected cities from 2000 to 2010 at urban backgound and traffic locations.
Bottom: PM10 concentrations in selected cities from 2000 to 2010 at urban backgound and traffic locations.
Values are presented for single monitoring stations that provide reliable time series data for the period 2000 to 2010. Selected cities have at least one background and one traffic station that provide such reliability and can therefore be compared for analysis. Therefore, this figure does not represent air quality results citywide, but rather serves as a snapshot of the different trends in background and traffic stations wherever comparable long-term time-series data are available. Because the different lines represent individual measurement points, there can be a significant effect from local changes in traffic flows.

 taken in account for the measurement values(s) of the data resource.")
Document Actions
Share with others