The geographical coverage is the 38 EEA member countries, but only complete time series are included in the analysis. The selected time series are aggregated to European level by averaging across all sites for each year.
Two time series are shown – a longer time series representing fewer water bodies and a shorter time series representing more water bodies.
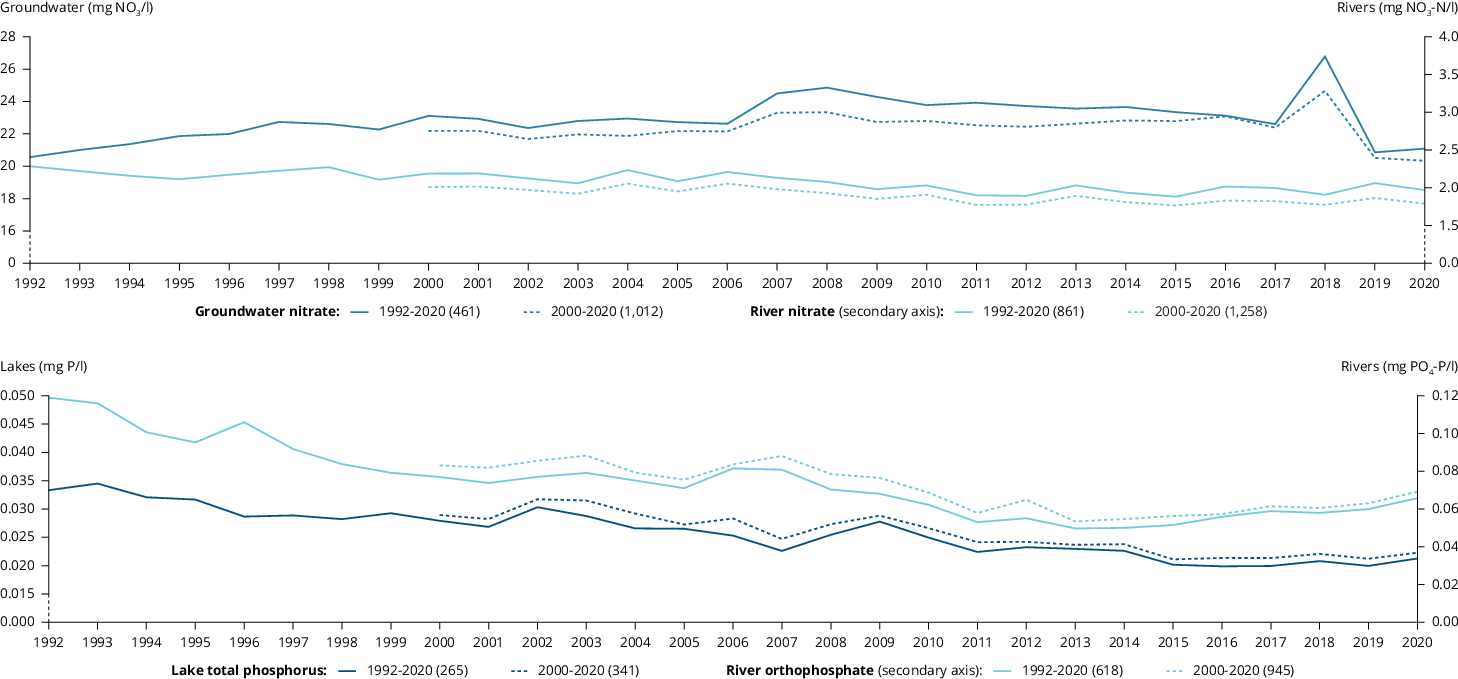
Upper chart:
Nitrate in groundwater: The number of groundwater bodies included per country is given in parenthesis:
- 1992-2020: Europe (461), Austria (13), Belgium (24), Bulgaria (25), Denmark (1), Estonia (16), Finland** (7), France (247), Germany (66), Ireland (50), Portugal (2), Slovakia (4), Slovenia (5), Spain (1).
- 2000-2020: Europe (1012), Austria (14), Belgium (37), Bulgaria (40), Cyprus (6), Czechia (64), Denmark (4), Estonia (18), Finland** (8), France (437), Germany (175), Ireland (66), Italy (10), Latvia (15), Malta (2), Portugal (10), Serbia (21), Slovakia (16), Slovenia (6), Spain (26), Switzerland (37).
Nitrate in rivers: The number of river monitoring sites included per country is given in parenthesis:
- 1992-2020: Europe (861), Albania (3), Austria (39), Belgium (26), Czechia (22), Denmark* (37), Estonia (34), Finland** (61), France** (184), Germany (119), Ireland** (3), Latvia (13), Lithuania (22), Poland (13), Slovakia (8), Slovenia (7), Spain** (153), Sweden* (111), Switzerland (6).
- 2000-2020: Europe (1258), Albania (7), Austria (41), Belgium (34), Cyprus (14), Czechia (22), Denmark* (38), Estonia (36), Finland** (70), France** (241), Germany (122), Iceland (1), Ireland** (17), Italy (25), Latvia (16), Lithuania (22), North Macedonia (18), Poland (16), Romania (89), Serbia (34), Slovakia (8), Slovenia (8), Spain** (250), Sweden* (113), Switzerland (16).
(* = all data total oxidised nitrogen, ** = some data total oxidised nitrogen)"
Lower chart:
Phosphate in rivers: The number of river monitoring sites included per country is given in parenthesis:
- 1992-2020: Europe (618), Austria (27), Belgium (24), Bulgaria (32), Czechia (10), Denmark (39), Estonia (35), Finland (60), France (166), Ireland (4), Latvia (13), Lithuania (22), Norway (21), Slovakia (6), Slovenia (9), Spain (33), Sweden (111), Switzerland (6).
- 2000-2020: Europe (945), Albania (3), Austria (41), Belgium (28), Bulgaria (53), Croatia (23), Czechia (10), Denmark (40), Estonia (37), Finland (67), France (240), Iceland (1), Ireland (11), Italy (18), Latvia (16), Lithuania (22), Norway (21), Romania (88), Serbia (34), Slovakia (6), Slovenia (10), Spain (47), Sweden (113), Switzerland (16).
Total phosphorus in lakes: The number of lake monitoring sites included per country is given in parenthesis:
- 1992-2020: Europe (265), Austria (5), Denmark (5), Estonia (7), Finland (144), Germany (2), Lithuania (2), Netherlands (6), Norway (2), Slovenia (2), Sweden (90).
- 2000-2020: Europe (341), Austria (27), Belgium (1), Bulgaria (1), Croatia (3), Denmark (5), Estonia (8), Finland (168), France (1), Germany (6), Lithuania (3), Netherlands (6), Norway (3), Poland (9), Serbia (3), Slovenia (3), Sweden (95).


Document Actions
Share with others