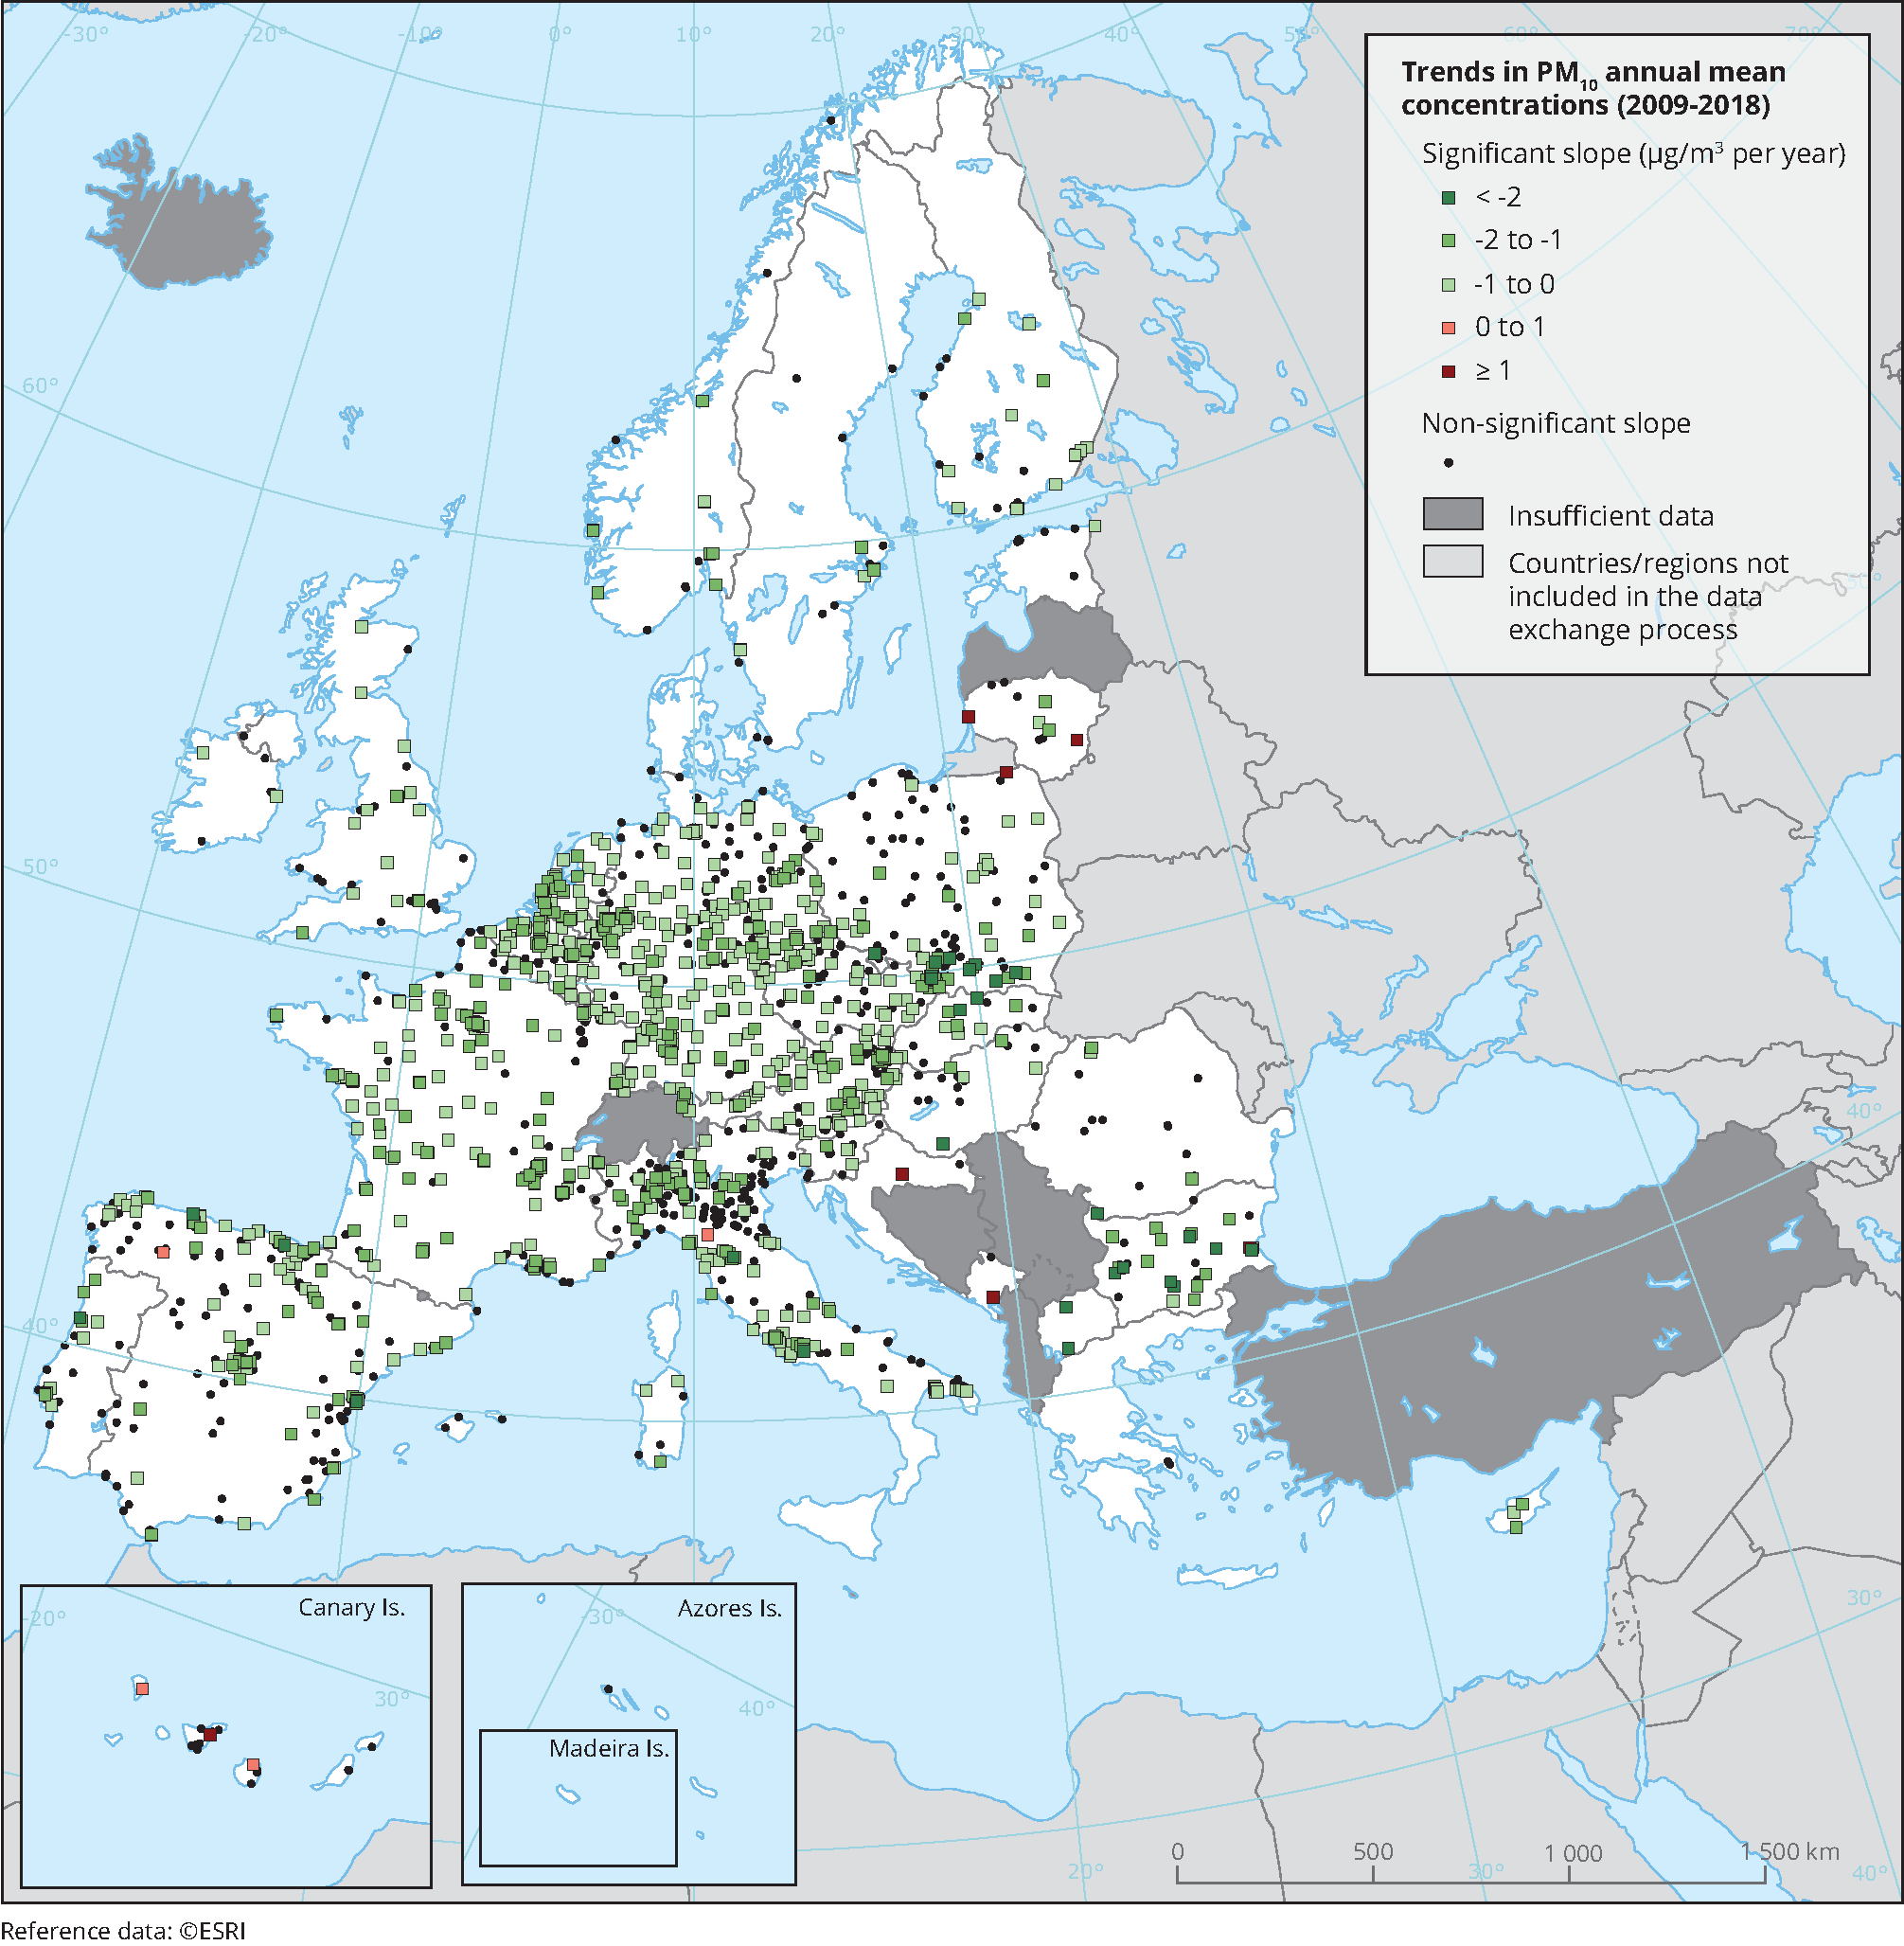
Trend analysis considering PM10 annual mean observations at monitoring sites. The stations considered are those included in the EEA's AQ e-reporting database that fulfilled the following criteria: at least 75% of the records available for a year to consider that year valid; and at least 8 valid years (75% of the years in the time period analysed). Furthermore, metadata on the station and area types have to be available for the stations to be considered. The statistical method applied for the trend detection is the Mann-Kendall test (with an α of 0.05) and the actual slope is estimated using the Sen-Theil approach. A trend is considered significant when the level of significance of the Mann-Kendall test, p-value, is lower than 0.05 (α). That means that there is a 95 % probability of existence of a monotonic trend (the stations appears as a colour square in the map, with the colour indicating the value of the trend). If, on the contrary, there is less than 95 % probability of existence of a monotonic trend, there is no trend and the stations is considered as with “non-significant” trend (black dots in the maps).

 taken in account for the measurement values(s) of the data resource.")
Document Actions
Share with others