All official European Union website addresses are in the europa.eu domain.
See all EU institutions and bodies
An official website of the European Union | How do you know?
Environmental information systems
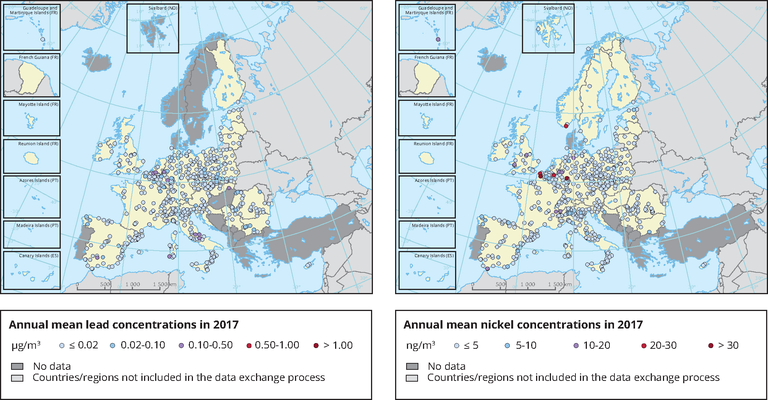
Observed concentrations of lead (left) and nickel (right) in 2017. The map shows the lead and nickel annual mean concentrations. The dots in the last two colour categories indicate stations with concentrations exceeding the target value (0.5 µg/m3 for lead and 20 ng/m3 for nickel). Only stations with more than 14 % of valid data have been included in the map.
Loading